New
New
Interpolation versus extrapolation
I can state the difference between interpolation and extrapolation and the limitations of each.
New
New
Interpolation versus extrapolation
I can state the difference between interpolation and extrapolation and the limitations of each.
These resources will be removed by end of Summer Term 2025.
Switch to our new teaching resources now - designed by teachers and leading subject experts, and tested in classrooms.
Lesson details
Key learning points
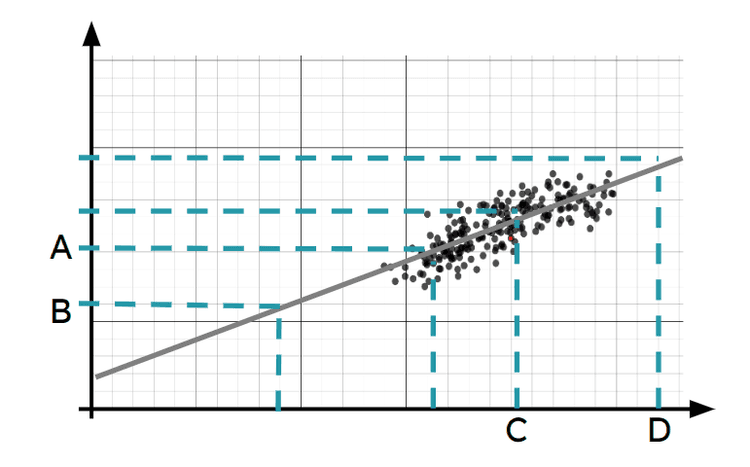
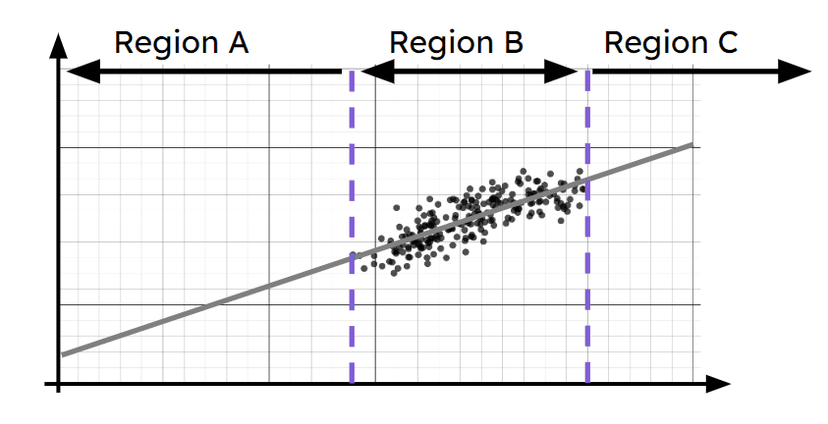
- Interpolation can be used to estimate a value within the data set.
- Extrapolation can be used to estimate a value outside of the data set.
- Extrapolation may not be valid as this is outside observed set of data values.
- Interpolation may not be valid due to the limitations of sampling.
Keywords
Interpolation - Interpolation is the process of estimating unknown values that are inside the range of existing data.
Extrapolations - Extrapolation is the process of estimating unknown values that are outside the range of existing data.
Common misconception
Interpolation and extrapolation always produce accurate predictions.
Extrapolation may not be valid as this is outside the observed set of data values (e.g. a linear trend might not continue indefinitely). Interpolation may not be valid due to the limitations of the data set.
Pupils could explore previous scatter graphs they have seen with correlation or find scatter graphs on the internet. They could then discuss what potential problems there may be with using extrapolation to produce predictions in the context of that data.
Teacher tip
Licence
This content is © Oak National Academy Limited (2024), licensed on Open Government Licence version 3.0 except where otherwise stated. See Oak's terms & conditions (Collection 2).
Starter quiz
Download starter quiz
6 Questions
Q1.
A is a line where the distance between each data point and the line is minimised.
Q2.
Aisha says the line of best fit must always go through the point (0, 0). Is Aisha correct?
No, only lines of best fit for positive correlation go through the (0, 0).
Yes, when one variable is zero the other must be too.
Yes, it should always start in the bottom left corner of the graph.
Q3.
Which of these graphs do not have appropriate line of best fit?


Q4.
The scatter graph shows data taken from the ONS, where each point represents a region in the UK. Use the line of best fit to estimate emissions of a population of 400 000

500 kt CO2e
750 kt CO2e
500 000 kt CO2e
550 000 kt CO2e
Q5.
The scatter graph shows data taken from the ONS about regions in the UK. An estimate for the median house price in a region where the median income is £35 000 is £ to the nearest thousand.

Q6.
The scatter graph shows data taken from the ONS about regions in the UK. The population of a region is predicted to change from 200 000 to 500 000. Estimate how many more cell towers the region needs.

2000
4000
9000
11 000
Exit quiz
Download exit quiz
6 Questions
Q1.
Interpolation is when you estimate values that are the range of available data.
Q2.
Which values are obtained by extrapolation on this scatter diagram?

A
C
Q3.
Select the regions where interpolation can be used to make estimations on this scatter graph.

A only
C only
A and C
B and C
Q4.
Alex says, “I can always use extrapolation to make a valid prediction when my bivariate data has correlation.” Is Alex correct?
No, extrapolation is always completely unreliable.
Yes, extrapolation is always completely reliable.
Yes, you can make accurate predictions by extending your line of best fit.
Q5.
The scatter graph shows data taken from the ONS, where each point represents a region in England and Wales in 2023. Select which of these Oak pupils can use this graph to make an accurate prediction.

Jacob: I want the house price in the USA where the median income is £30 000
Jun: I want the house price in Oakford where the median income is £20 000
Sam: I want the house price in Elmway where the median income is £80 000
Q6.
The scatter graphs shows information about house prices and income in different regions. Estimate the difference between the house prices in the North and South for a median income of £30 000

£100 000
£175 000
£250 000
£375 000