Myths about teaching can hold you back

- Year 11•
- AQA•
- Higher
Effect of osmosis and sugar concentration on the mass of plant tissue: analysis
I can interpret a graph showing the effect of sugar concentration on the mass of potato tissue, and explain the results.
- Year 11•
- AQA•
- Higher
Effect of osmosis and sugar concentration on the mass of plant tissue: analysis
I can interpret a graph showing the effect of sugar concentration on the mass of potato tissue, and explain the results.
Lesson details
Key learning points
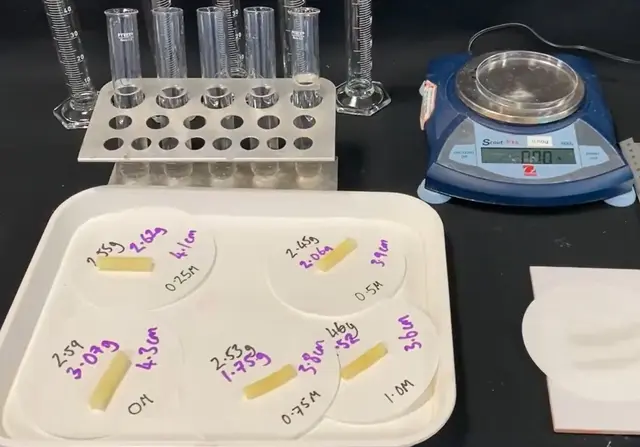
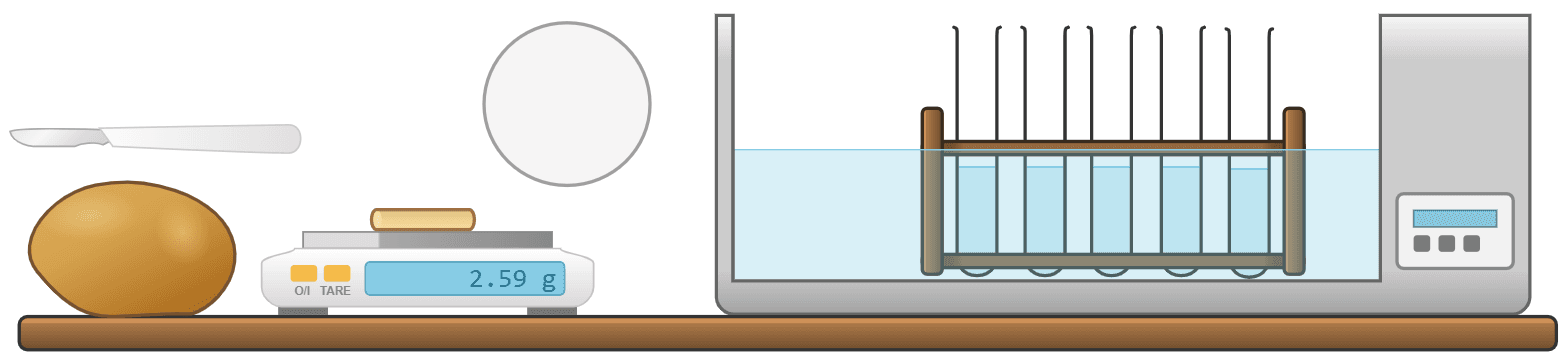
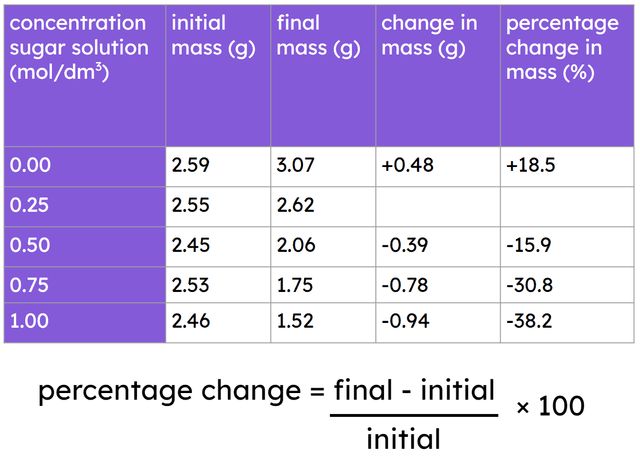
- Plotting and interpretation of a graph showing the effect of sugar concentration on the mass of potato tissue.
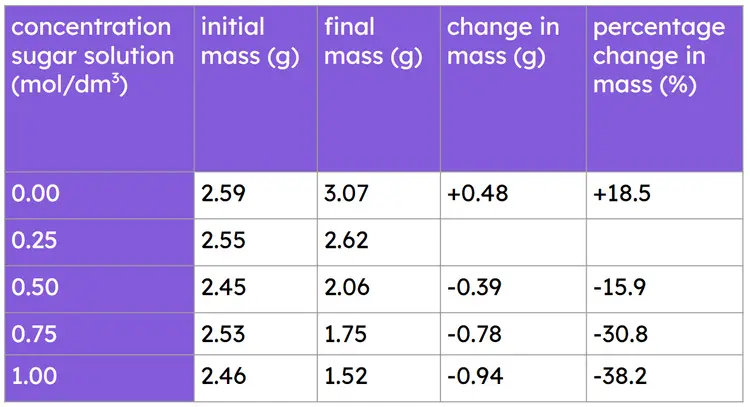
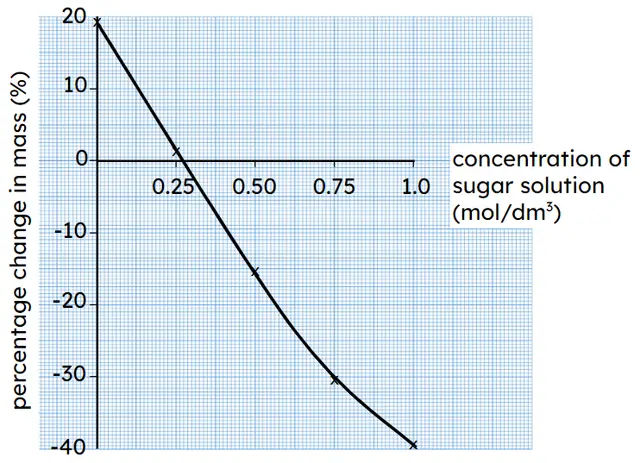
- Increase in potato mass means water moved in by osmosis (because the sugar solution was more dilute outside).
- Decrease in potato mass means water moved out by osmosis (because the sugar solution was more concentrated outside).
- The concentration of sugar in the potato tissue can be determined from the point at which there was no change in mass.
- At this point the sugar concentration was equal inside and out, so there was no net movement of water.
Keywords
Osmosis - the net movement of water molecules through a selectively-permeable membrane from a dilute solution to a concentrated one
Net movement - the overall movement of particles
Random error - causes results to differ by different amounts due to a factor other than the independent variable (the factor we changed)
Concentration gradient - a difference in the concentration of particles from one area to another
Common misconception
Mistakes around calculating change in percentage mass are common, as are misunderstandings around why changes in mass occur.
The calculations for percentage mass are introduced and walked through with an 'I-do, we-do, you-do' model. There are plenty of calculations to practice on. Why mass changes occur is also covered in detail and with supporting diagrams.
To help you plan your year 11 biology lesson on: Effect of osmosis and sugar concentration on the mass of plant tissue: analysis, download all teaching resources for free and adapt to suit your pupils' needs...
To help you plan your year 11 biology lesson on: Effect of osmosis and sugar concentration on the mass of plant tissue: analysis, download all teaching resources for free and adapt to suit your pupils' needs.
The starter quiz will activate and check your pupils' prior knowledge, with versions available both with and without answers in PDF format.
We use learning cycles to break down learning into key concepts or ideas linked to the learning outcome. Each learning cycle features explanations with checks for understanding and practice tasks with feedback. All of this is found in our slide decks, ready for you to download and edit. The practice tasks are also available as printable worksheets and some lessons have additional materials with extra material you might need for teaching the lesson.
The assessment exit quiz will test your pupils' understanding of the key learning points.
Our video is a tool for planning, showing how other teachers might teach the lesson, offering helpful tips, modelled explanations and inspiration for your own delivery in the classroom. Plus, you can set it as homework or revision for pupils and keep their learning on track by sharing an online pupil version of this lesson.
Explore more key stage 4 biology lessons from the Coordination and control: maintaining a constant internal environment unit, dive into the full secondary biology curriculum, or learn more about lesson planning.

Equipment
graph paper, rulers, pencils, calculators
Licence
Lesson video
Loading...
Prior knowledge starter quiz
6 Questions
Q1.Match each variable to the correct example when investigating the effect of sugar solution concentration on potato chips.
independent variable -
concentration of sugar solution
dependent variable -
mass and length of potato chips
control variable -
temperature of the solutions
Q2.When investigating the effect of sugar solution concentration on potato chips, which piece of apparatus was used to control the temperature?
Q3.At which concentration did the potato chip decrease in mass?
Q4.Which concentration caused the potato chips to lose water by osmosis?
Q5.Whose prediction is correct?


Q6.Water can move out of and into potato chips because the potato cells have a selectively- membrane.
Assessment exit quiz
6 Questions
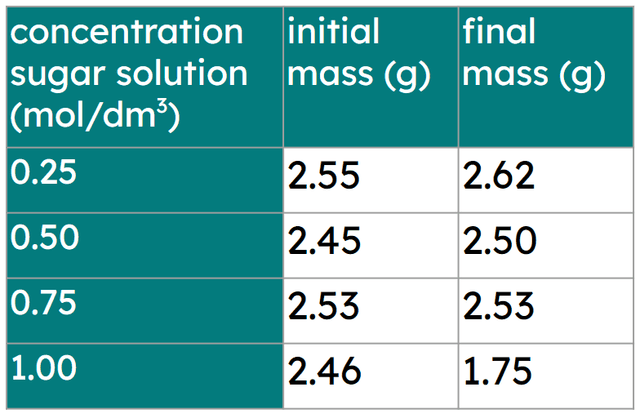
Q1.Calculate the change in mass, in grams (g), for the potato chip in sugar solution at a concentration of 0.25 mol/dm$$^3$$.
Q2.Calculate the percentage change in mass (%) for the potato chip in sugar solution at a concentration of 0.25 mol/dm$$^3$$. Give your answer to 2 decimal places.
Q3.Why is it necessary to calculate the percentage change in mass before comparing the effect of concentration on the potato chips?
Q4.Calculating the percentage change in mass helps to remove __________ error from the results.
Q5.Match each direction of water movement to where it is shown on the graph.
net movement into potato chip cells -
when the line is above the x-axis
net movement out of potato chip cells -
when the line is below the x-axis
no net movement -
when the line crosses the x-axis
Q6.Which point on the graph enables us to estimate the concentration of sugar inside the potato chip cells?