Myths about teaching can hold you back

- Year 11
- OCR
- Higher
Transfers of biomass between trophic levels
I can explain biomass transfer between trophic levels in food chains and calculate the efficiency of biomass transfers.
- Year 11
- OCR
- Higher
Transfers of biomass between trophic levels
I can explain biomass transfer between trophic levels in food chains and calculate the efficiency of biomass transfers.
Lesson details
Key learning points
- All food chains start with a producer that makes the biomass that is transferred to consumers in higher trophic levels.
- Not all biomass from a trophic level is passed to the next one (due to respiration, uneaten parts, egestion, excretion).
- Pyramids of biomass are scaled diagrams that can be used to show the amount of biomass present at each trophic level.
- % efficiency of biomass transfer = (biomass in higher trophic level ÷ biomass in lower trophic level) × 100
- How efficiency of biomass transfer affects the number of organisms in higher trophic levels.
Keywords
Producer - A producer is an organism that makes its own food.
Biomass - Biomass is the mass of living material in one or more organisms.
Trophic level - A trophic level is the position of an organism in a food chain diagram.
Pyramid of biomass - A pyramid of biomass is a diagram which shows the biological mass (biomass) of organisms at each trophic level in a food chain diagram.
Efficiency - The efficiency is how much of something is transferred compared to how much is available, e.g. how much biomass is transferred to a consumer compared to how much is available.
Common misconception
A misconception that is often seen is that there is a build up of biomass along a food chain.
The lesson outlines how biomass is actually lost between trophic levels through life processes.
To help you plan your year 11 biology lesson on: Transfers of biomass between trophic levels, download all teaching resources for free and adapt to suit your pupils' needs...
To help you plan your year 11 biology lesson on: Transfers of biomass between trophic levels, download all teaching resources for free and adapt to suit your pupils' needs.
The starter quiz will activate and check your pupils' prior knowledge, with versions available both with and without answers in PDF format.
We use learning cycles to break down learning into key concepts or ideas linked to the learning outcome. Each learning cycle features explanations with checks for understanding and practice tasks with feedback. All of this is found in our slide decks, ready for you to download and edit. The practice tasks are also available as printable worksheets and some lessons have additional materials with extra material you might need for teaching the lesson.
The assessment exit quiz will test your pupils' understanding of the key learning points.
Our video is a tool for planning, showing how other teachers might teach the lesson, offering helpful tips, modelled explanations and inspiration for your own delivery in the classroom. Plus, you can set it as homework or revision for pupils and keep their learning on track by sharing an online pupil version of this lesson.
Explore more key stage 4 biology lessons from the Maintaining biodiversity and human impacts unit, dive into the full secondary biology curriculum, or learn more about lesson planning.

Equipment
None required.
Licence
Lesson video
Loading...
Prior knowledge starter quiz
6 Questions
Q1.Look at the food chain diagram below. Name the producer.

Q2.Look at the food web diagram. What type of organism is the triggerfish?
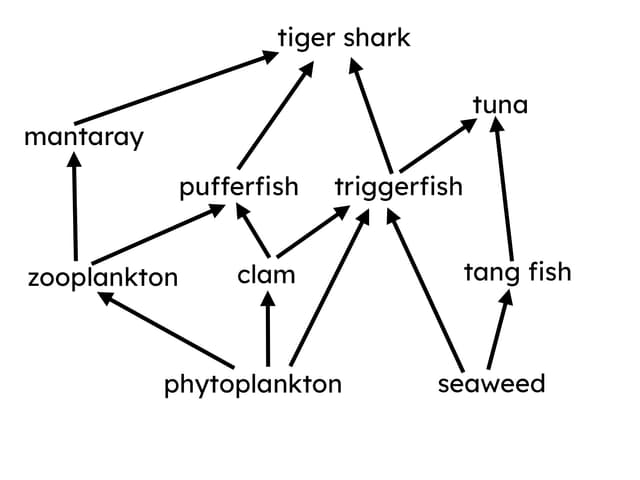
Q3.How many apex predators are there in this food web and what organisms are they?
Q4.What word describes the amount of living material found in one or more organisms?
Q5.Which option correctly matches the predator to the prey, based on the food web below?
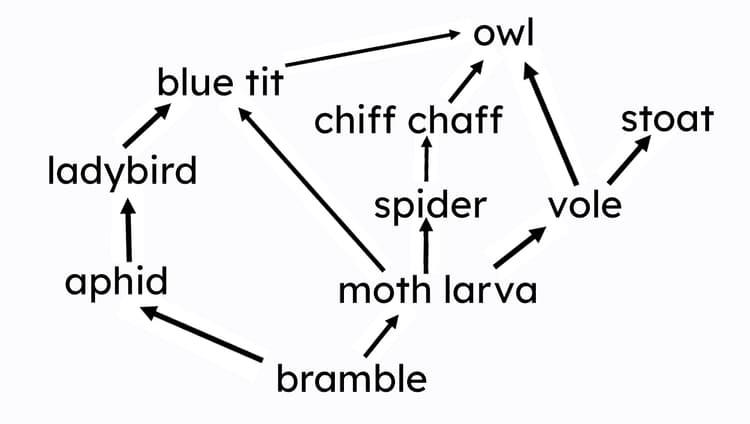
Q6.The diagram below shows a food chain. If the number of ladybirds decreases due to disease, what will happen to the numbers of other organisms in the food chain?

Assessment exit quiz
6 Questions
Q1.Look at the food chain diagram below. Match the organism to the correct trophic level it occupies.

producer
primary consumer
secondary consumer
tertiary consumer
quaternary consumer
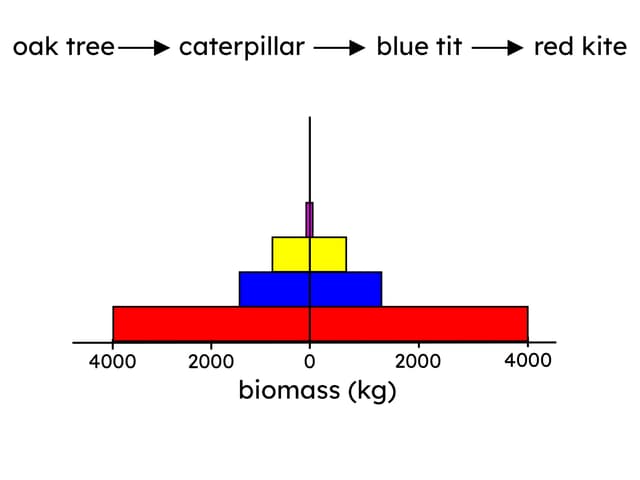
Q2.Look at the pyramid of biomass. What can you tell from the pyramid of biomass?
Q3.In food chains, biomass can be lost between different trophic levels. One example is when food that is eaten is not digested. The undigested food is released from the body. What is the release called?
Q4.Food chains show how food (biomass) is transferred from one organism to another. Most food chains contain five trophic levels or less. Why are food chains not longer than this?
Q5.How much of something (e.g. biomass) is transferred compared to how much is available is known as what?
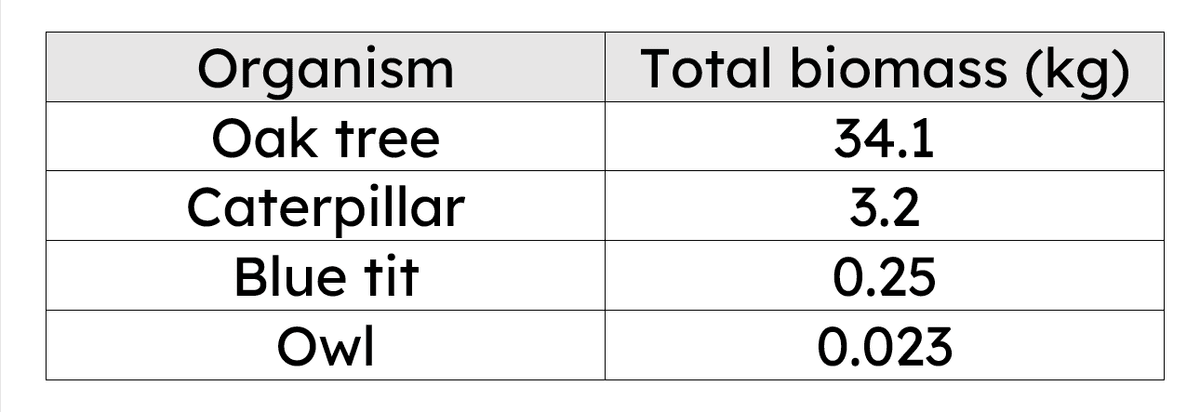
Q6.Look at the table of biomasses of organisms that could be found in a food chain diagram. What is the approximate percentage efficiency of biomass transfer between each trophic level?