Myths about teaching can hold you back

- Year 10
- AQA
- Higher
- Year 10
- AQA
- Higher
Heating curves: practical
I can collect data reliably and represent it appropriately.
Lesson details
Key learning points
- An investigation can measure the temperature change through continuous heating of a substance.
- Heating curve observations are best presented in a table and graphically.
- Reliable data can be collected by taking repeat measurements, identifying anomalies and calculating a mean.
- Heating curves can be used to determine the melting point of a substance.
Keywords
Independent variable - the single variable that is changed in an investigation
Dependent variable - the single variable that is measured or observed in an investigation
Control variable - all variables, other than the independent and dependent variables, that are kept the same in an investigation
Common misconception
Pupils can often think that when the temperature is not increasing, i.e. at a change of state, that the experiment is 'not working'.
Question students whilst circulating the class about what they would expect to see and try to get them to imagine what is happening to the particles. Use the heating curve to explain why the temperature did not increase during state changes.
To help you plan your year 10 combined science lesson on: Heating curves: practical, download all teaching resources for free and adapt to suit your pupils' needs...
To help you plan your year 10 combined science lesson on: Heating curves: practical, download all teaching resources for free and adapt to suit your pupils' needs.
The starter quiz will activate and check your pupils' prior knowledge, with versions available both with and without answers in PDF format.
We use learning cycles to break down learning into key concepts or ideas linked to the learning outcome. Each learning cycle features explanations with checks for understanding and practice tasks with feedback. All of this is found in our slide decks, ready for you to download and edit. The practice tasks are also available as printable worksheets and some lessons have additional materials with extra material you might need for teaching the lesson.
The assessment exit quiz will test your pupils' understanding of the key learning points.
Our video is a tool for planning, showing how other teachers might teach the lesson, offering helpful tips, modelled explanations and inspiration for your own delivery in the classroom. Plus, you can set it as homework or revision for pupils and keep their learning on track by sharing an online pupil version of this lesson.
Explore more key stage 4 combined science lessons from the States of matter unit, dive into the full secondary combined science curriculum, or learn more about lesson planning.

Equipment
bunsen burner, tripod, beaker for water bath, gauze, heat resistant mat, clamp and stand, thermometer, boiling tube, substances to heat e.g. stearic acid, salol, graph paper
Content guidance
- Risk assessment required - equipment
Supervision
Adult supervision required
Licence
Lesson video
Loading...
Prior knowledge starter quiz
6 Questions
Q1.Which of these are essential things you need to do when planning an experiment?
Q2.Put the following steps in order to describe a method for collecting data to plot a heating curve of the solid substance shown in the boiling tube. Begin with 'collect all the equipment'.
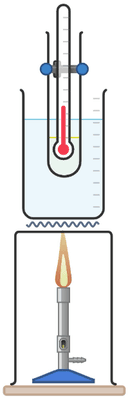
Q3.What is a gauze used for? On this diagram, it is represented by the wavy line between the tripod and the beaker.
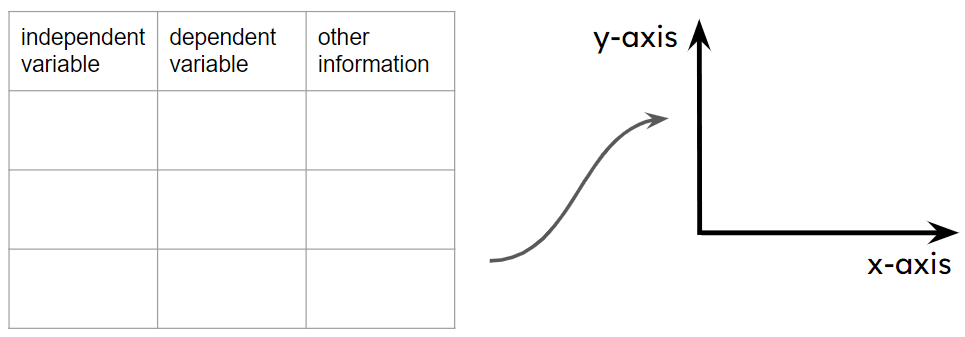
Q4.A table for results should include columns to record independent and dependent variables and and other necessary information. The dependent variable is usually recorded in the column.
Q5.Which safety precautions are needed for a heating curve experiment, in which a solid is melted in a water bath, with its temperature measured over time?
Q6.When transferring information from a results table to a graph, which variable should be plotted along the x-axis?
Assessment exit quiz
6 Questions
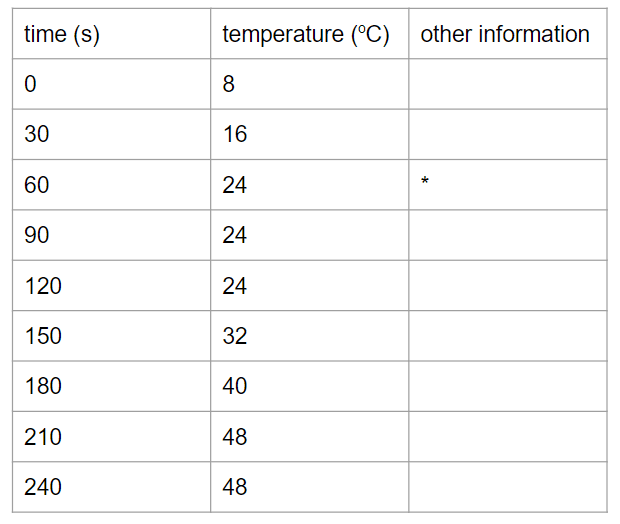
Q1.The table shows data from a heating curve experiment. What is the main reason why it is helpful to plot a graph of these results?
Q2.Match the key terms to their definitions.
variable that you change or select values for
variable that you measure or observe to get your results
variable that must remain the same throughout an investigation
value that does not fit the pattern of the results
average calculated by adding all values, dividing by number of results
Q3.What can you do to improve the reliability of a set of results?
Q4.The table shows data from a heating curve experiment. What would be useful other information to record for each measurement?
Q5.The image shows a results table from either a heating or a cooling curve experiment, and from either a pure substance or a mixture. Which of the following statements is true?
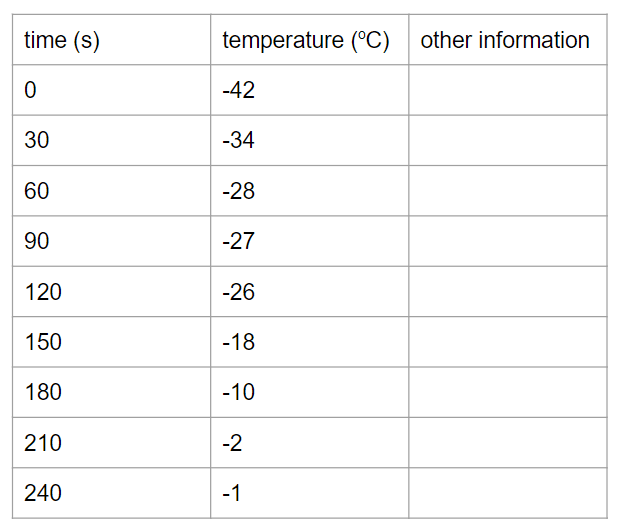
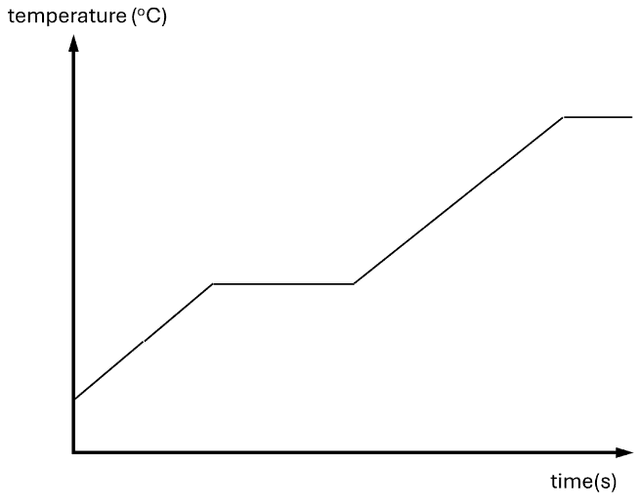
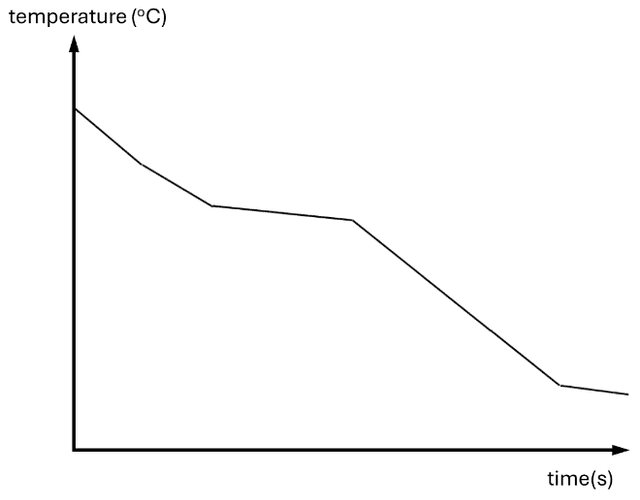
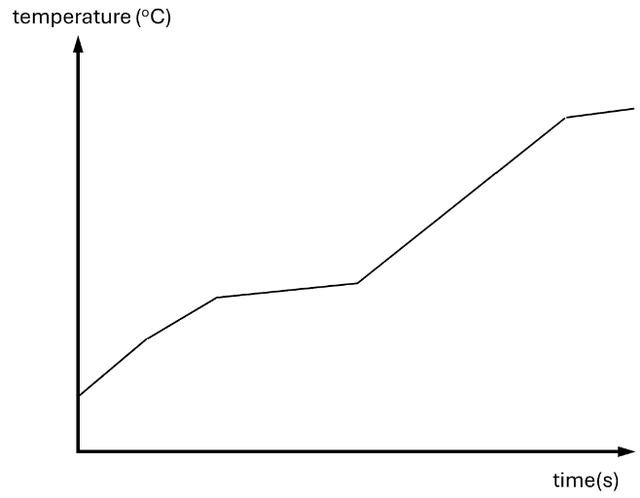
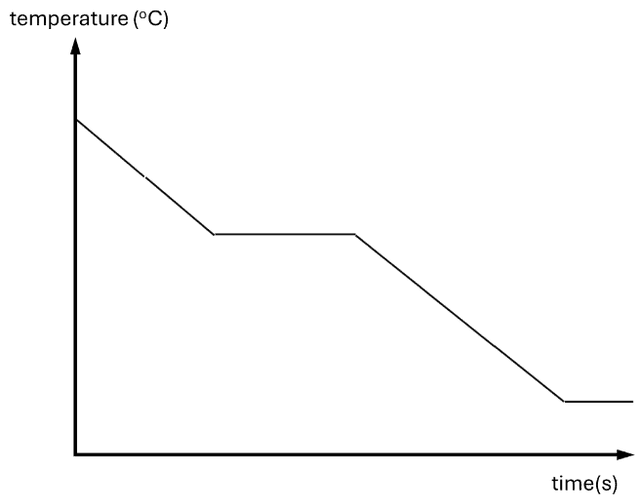
Q6.Considering the data in the table at the start of the experiment, which graph would be the most likely to represent the results for the whole experiment?