Resistance of a wire at a constant temperature
I can describe how to investigate the resistance of a wire at a constant temperature and make scientific conclusions.
Resistance of a wire at a constant temperature
I can describe how to investigate the resistance of a wire at a constant temperature and make scientific conclusions.
These resources will be removed by end of Summer Term 2025.
Lesson details
Key learning points
- A wire heats up when a current flows and its temperature will vary over time.
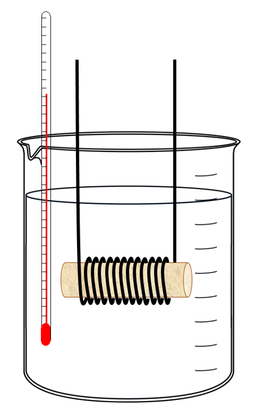
- A water bath helps to keep the temperature of a wire constant.
- Turning a circuit on for a very short time reduces the heating effect in a wire.
- In electricity investigations, it is often easy to take lots of readings rather than a few, repeated readings.
- The resistance of a wire is directly proportional to its length, at a constant temperature.
Keywords
Independent variable - the variable that the person doing the experiment changes
Dependent variable - the variable that is measured; it changes as a result of varying the independent variable
Control variable - a variable that needs to be kept the same to allow a fair test to be carried out
Random error - a type of error that affects results in an unpredictable way
Directly proportional - describes the relationship between two variables if both increase in the same proportion as each other
Common misconception
Pupils may not realise that the resistance of a wire varies with temperature.
Ensure pupils are aware that the temperature of a metal wire does affect resistance and that precautions should be taken to avoid a temperature change.
To help you plan your year 10 combined science lesson on: Resistance of a wire at a constant temperature, download all teaching resources for free and adapt to suit your pupils' needs...
To help you plan your year 10 combined science lesson on: Resistance of a wire at a constant temperature, download all teaching resources for free and adapt to suit your pupils' needs.
The starter quiz will activate and check your pupils' prior knowledge, with versions available both with and without answers in PDF format.
We use learning cycles to break down learning into key concepts or ideas linked to the learning outcome. Each learning cycle features explanations with checks for understanding and practice tasks with feedback. All of this is found in our slide decks, ready for you to download and edit. The practice tasks are also available as printable worksheets and some lessons have additional materials with extra material you might need for teaching the lesson.
The assessment exit quiz will test your pupils' understanding of the key learning points.
Our video is a tool for planning, showing how other teachers might teach the lesson, offering helpful tips, modelled explanations and inspiration for your own delivery in the classroom. Plus, you can set it as homework or revision for pupils and keep their learning on track by sharing an online pupil version of this lesson.
Explore more key stage 4 combined science lessons from the Electric fields and circuit calculations unit, dive into the full secondary combined science curriculum, or learn more about lesson planning.

Equipment
Nichrome wire, crocodile clips, electrical leads, metre ruler, voltmeter and ammeter.
Content guidance
- Risk assessment required - equipment
Supervision
Adult supervision required
Licence
Starter quiz
6 Questions
V
Ω
A
a variable that needs to be kept the same in a fair test
the variable that is measured to get a set of results
the variable that the experimenter selects values for
$$y$$-axis
does not appear on the graph
$$x$$-axis
Exit quiz
6 Questions


