Myths about teaching can hold you back

- Year 3
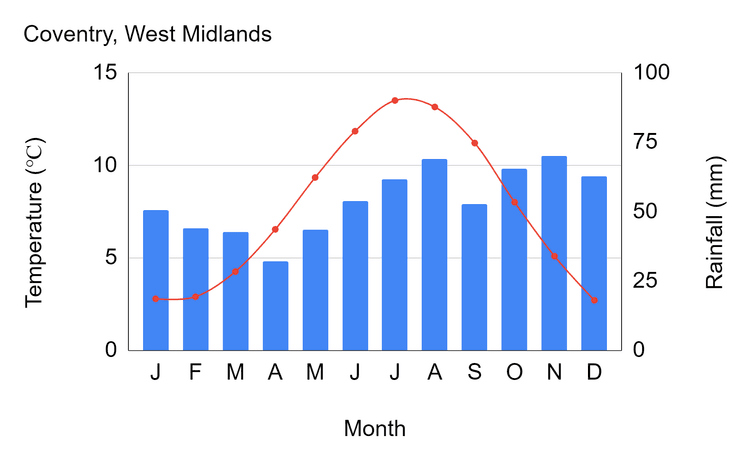
Climate data and patterns
I can read information from climate graphs and identify patterns in data
- Year 3
Climate data and patterns
I can read information from climate graphs and identify patterns in data
Lesson details
Key learning points
- Climate data can be presented in graphs in different ways.
- Climate graphs usually show rainfall and temperature over a period of time, often as monthly figures over a year.
- The climate in different climate zones has distinct patterns of rainfall and temperature throughout a year.
- Climate has an impact on where and how people live.
Keywords
Climate graph - A climate graph shows the amount of precipitation and the temperature each month for a location.
Data - Data is a collection of information that can be analysed to help us answer a question.
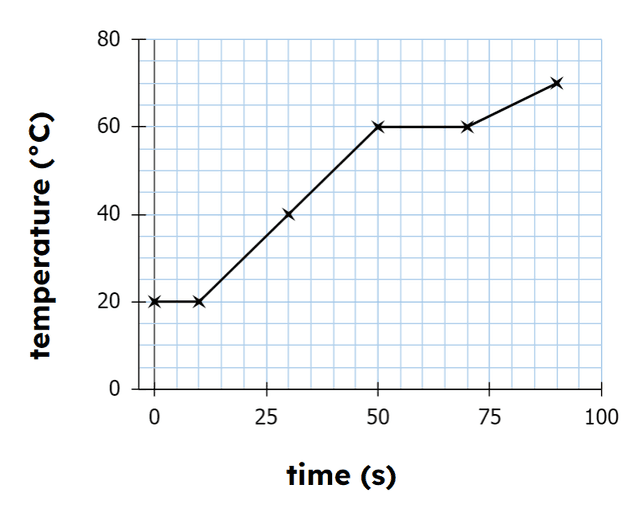
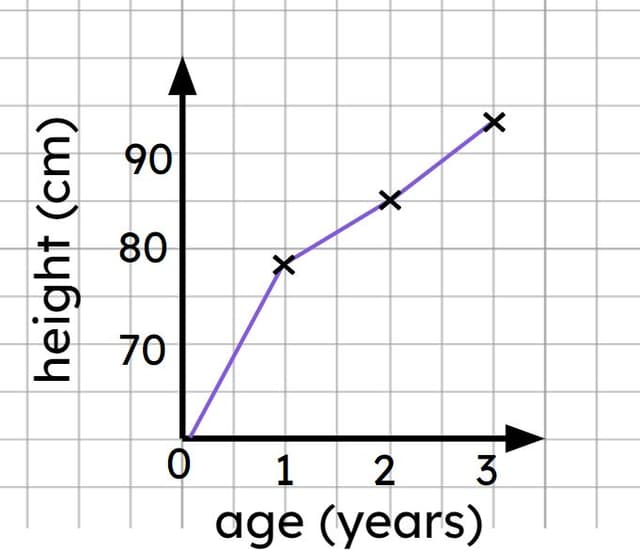
Horizontal axis - The horizontal axis is the line of figures or data along the bottom of a graph.
Vertical axis - The vertical axis is a line of figures or data that is at the side of a graph.
Common misconception
In early work with graphs and charts, pupils can easily mix up the axes and try to put the values in the wrong places on graphs like climate graphs.
On graphs that show change over time, like climate graphs, the horizontal axis shows time (months of the year on a climate graph). The vertical axes are for numerical values representing measurements (rainfall and temperature on a climate graph).
To help you plan your year 3 geography lesson on: Climate data and patterns, download all teaching resources for free and adapt to suit your pupils' needs...
To help you plan your year 3 geography lesson on: Climate data and patterns, download all teaching resources for free and adapt to suit your pupils' needs.
The starter quiz will activate and check your pupils' prior knowledge, with versions available both with and without answers in PDF format.
We use learning cycles to break down learning into key concepts or ideas linked to the learning outcome. Each learning cycle features explanations with checks for understanding and practice tasks with feedback. All of this is found in our slide decks, ready for you to download and edit. The practice tasks are also available as printable worksheets and some lessons have additional materials with extra material you might need for teaching the lesson.
The assessment exit quiz will test your pupils' understanding of the key learning points.
Our video is a tool for planning, showing how other teachers might teach the lesson, offering helpful tips, modelled explanations and inspiration for your own delivery in the classroom. Plus, you can set it as homework or revision for pupils and keep their learning on track by sharing an online pupil version of this lesson.
Explore more key stage 2 geography lessons from the Climate zones: what are they and why do they matter? unit, dive into the full primary geography curriculum, or learn more about lesson planning.

Licence
Lesson video
Loading...
Prior knowledge starter quiz
6 Questions
Q1.Which of these weather conditions is wet?
Q2.What name is given to the lines on maps that run horizontally around Earth?
Q3.Match the words to the definitions.
have similar weather conditions and climate, e.g. the Tropics
is the day to day condition of the atmosphere, e.g. sunny, wet, etc
is the degree of hotness or coldness of a place
Q4.Which line of latitude is closest to the equatorial climate zone?
Q5.Complete the sentence. There are two lines of latitude called tropics: the Tropic of Capricorn and the Tropic of ...
Q6.Complete the sentence. Climate zones are places with similar regular conditions.
Assessment exit quiz
6 Questions
Q1.What are the names of the axes on a graph?
Q2.Which of these are shown on a climate graph?
Q3.Which of these is a climate graph?
Q4.How is rainfall usually shown on a climate graph?
Q5.Which of these statements correctly describe the climate shown in this climate graph?