Myths about teaching can hold you back

- Year 3
Measuring change in a day
I can collect data over a school day to investigate changes in the school grounds during a single day.
- Year 3
Measuring change in a day
I can collect data over a school day to investigate changes in the school grounds during a single day.
Lesson details
Key learning points
- Places are not static and change over time.
- Fieldwork carried out at different points during one day helps us understand change.
- Revisiting the same place early am, lunchtime and pm to gather data will show change over a day.
Keywords
Tally chart - A tally chart is a quick way of recording counting of data using lines in groups of five.
Static - Something that is static does not move or change.
Fieldwork - Fieldwork is investigating the outdoors using geographical tools and thinking to gather information or data.
Equipment - Equipment is the set of tools or resources needed for a particular task or activity.
Common misconception
Children may not be familiar with tally charts as a method of recording.
Practise reading and writing tallies prior to the lesson would support their understanding.
To help you plan your year 3 geography lesson on: Measuring change in a day, download all teaching resources for free and adapt to suit your pupils' needs...
To help you plan your year 3 geography lesson on: Measuring change in a day, download all teaching resources for free and adapt to suit your pupils' needs.
The starter quiz will activate and check your pupils' prior knowledge, with versions available both with and without answers in PDF format.
We use learning cycles to break down learning into key concepts or ideas linked to the learning outcome. Each learning cycle features explanations with checks for understanding and practice tasks with feedback. All of this is found in our slide decks, ready for you to download and edit. The practice tasks are also available as printable worksheets and some lessons have additional materials with extra material you might need for teaching the lesson.
The assessment exit quiz will test your pupils' understanding of the key learning points.
Our video is a tool for planning, showing how other teachers might teach the lesson, offering helpful tips, modelled explanations and inspiration for your own delivery in the classroom. Plus, you can set it as homework or revision for pupils and keep their learning on track by sharing an online pupil version of this lesson.
Explore more key stage 2 geography lessons from the Local area: how is it changing? unit, dive into the full primary geography curriculum, or learn more about lesson planning.

Equipment
Cipboard and timer
Content guidance
- Risk assessment required - physical activity
Supervision
Adult supervision required
Licence
Lesson video
Loading...
Prior knowledge starter quiz
6 Questions
Q1.Match the keywords to their definitions.
a diagram or picture that displays data
to decide on the meaning of something
a collection of facts or figures
Q2.What kind of data can be added as data to maps?
Q3.Put the stages of enquiry in the correct order.
Q4.What are some tools that geographers use to collect data during fieldwork?
Q5.A group measured how far four different paper planes flew. They want to show the distances so it’s easy to compare them. Which graph would be best?
Q6.Why is it good to complete pedestrian counts at three different points during a day?
Assessment exit quiz
6 Questions
Q1.A __________ is a quick way of recording the counting of data using lines in groups of five.
Q2.Something that is does not move or change.
Q3.Places are static. True or false?
Q4.Which of these could change in a day?
Q5.How many people walked past the school gate at 9:00 am?
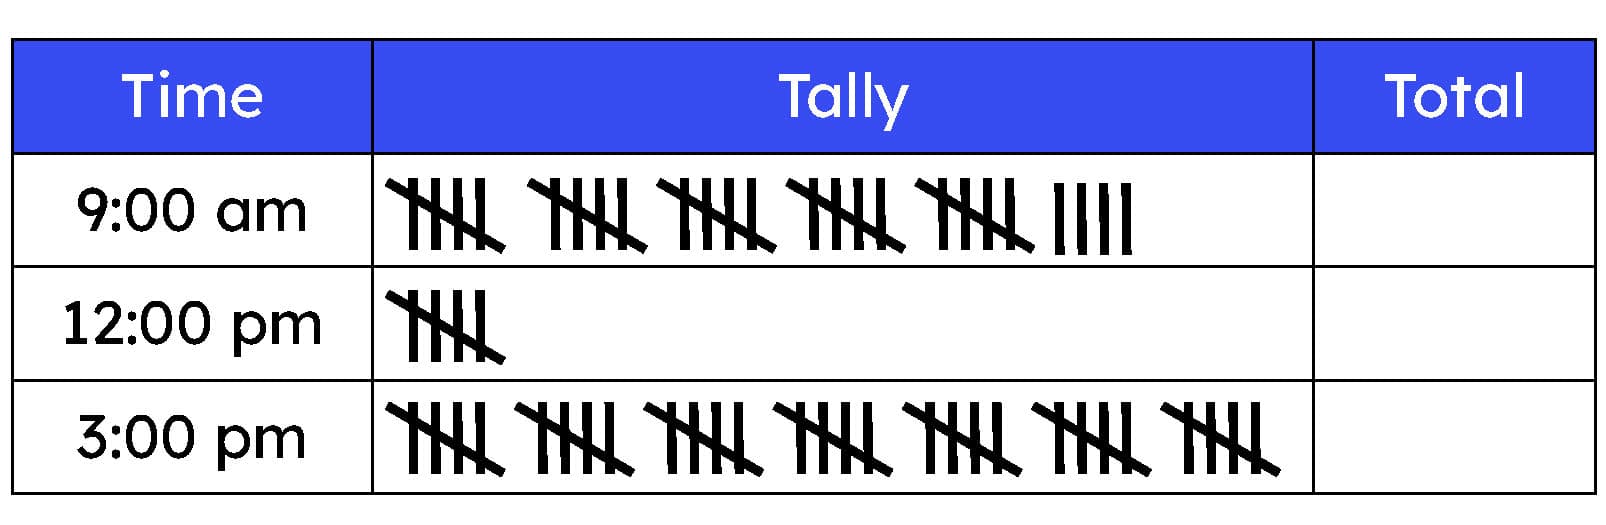
Q6.What was the quietest time of the day?