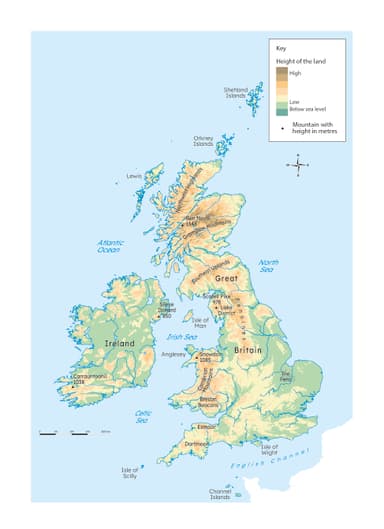
UK cities and population distribution
I can locate major cities of the UK and describe and explain the UK's uneven population distribution.
UK cities and population distribution
I can locate major cities of the UK and describe and explain the UK's uneven population distribution.
These resources will be removed by end of Summer Term 2025.
Lesson details
Key learning points
- There are 76 cities in the UK and the majority of these are in England.
- Population is unevenly distributed in the UK.
- Population density varies between the countries of the UK and areas within them.
- Human and physical factors can explain the differences in population distribution.
Keywords
Population distribution - the pattern of where people do and do not live
Population density - the average number of people that live within a square kilometre
Common misconception
Pupils can mix up population distribution and population density.
Population density is a spatial pattern of population whereas population density is the ratio of people to a defined space.
To help you plan your year 10 geography lesson on: UK cities and population distribution, download all teaching resources for free and adapt to suit your pupils' needs...
To help you plan your year 10 geography lesson on: UK cities and population distribution, download all teaching resources for free and adapt to suit your pupils' needs.
The starter quiz will activate and check your pupils' prior knowledge, with versions available both with and without answers in PDF format.
We use learning cycles to break down learning into key concepts or ideas linked to the learning outcome. Each learning cycle features explanations with checks for understanding and practice tasks with feedback. All of this is found in our slide decks, ready for you to download and edit. The practice tasks are also available as printable worksheets and some lessons have additional materials with extra material you might need for teaching the lesson.
The assessment exit quiz will test your pupils' understanding of the key learning points.
Our video is a tool for planning, showing how other teachers might teach the lesson, offering helpful tips, modelled explanations and inspiration for your own delivery in the classroom. Plus, you can set it as homework or revision for pupils and keep their learning on track by sharing an online pupil version of this lesson.
Explore more key stage 4 geography lessons from the Places and people in the UK unit, dive into the full secondary geography curriculum, or learn more about lesson planning.

Equipment
Licence
Starter quiz
6 Questions


London
Belfast
Edinburgh
Cardiff
Exit quiz
6 Questions
57.1 million
1.91 million
5.45 million
3.13 million
434 people per km2
137 people per km2
70 people per km2
153 people per km2


