Myths about teaching can hold you back

- Year 2
Calculate the difference when information is presented in a pictogram
I can calculate the difference when information is presented in a pictogram.
- Year 2
Calculate the difference when information is presented in a pictogram
I can calculate the difference when information is presented in a pictogram.
Lesson details
Key learning points
- A pictogram is a graph that uses pictures to represent information.
- A pictogram’s key tells us what each picture represents.
- Whole − part = difference
- We can calculate the difference by counting on from the known part to the whole.
Keywords
Pictogram - A way of showing data using images.
Difference - The result of subtracting one number from another. Way in which two or more things we are comparing are not the same.
Counting on - A mental strategy used to add numbers.
Subtraction - To partition one part from another (the subtrahend from the difference), or to decrease an amount by taking an amount away.
Common misconception
When comparing the larger to the smaller number and then the smaller to the larger number, children may record this as 15 - 8 = ? and 8 - 15 = ?
When finding the difference, we can compare the larger to the smaller number and the smaller to the larger number. Stress that each time, we record this in the same way as subtraction isn't commutative (whole - part = part).
To help you plan your year 2 maths lesson on: Calculate the difference when information is presented in a pictogram, download all teaching resources for free and adapt to suit your pupils' needs...
To help you plan your year 2 maths lesson on: Calculate the difference when information is presented in a pictogram, download all teaching resources for free and adapt to suit your pupils' needs.
The starter quiz will activate and check your pupils' prior knowledge, with versions available both with and without answers in PDF format.
We use learning cycles to break down learning into key concepts or ideas linked to the learning outcome. Each learning cycle features explanations with checks for understanding and practice tasks with feedback. All of this is found in our slide decks, ready for you to download and edit. The practice tasks are also available as printable worksheets and some lessons have additional materials with extra material you might need for teaching the lesson.
The assessment exit quiz will test your pupils' understanding of the key learning points.
Our video is a tool for planning, showing how other teachers might teach the lesson, offering helpful tips, modelled explanations and inspiration for your own delivery in the classroom. Plus, you can set it as homework or revision for pupils and keep their learning on track by sharing an online pupil version of this lesson.
Explore more key stage 1 maths lessons from the Calculating within 20 unit, dive into the full primary maths curriculum, or learn more about lesson planning.

Licence
Lesson video
Loading...
Prior knowledge starter quiz
6 Questions
Q1.Which of these equations will have a difference of 1?
Q2.The difference between 9 and 7 is
Q3.8 - = 6
Q4.7 - 7 =
Q5.2, 4, 6, 8, ____
If I skip count in twos, the next number will be
Q6.2, 4, 6, 8, 10, 12, 14, ___, 18, 20
When I was skip counting in twos, I missed a number. The missing number is
Assessment exit quiz
6 Questions
Q1.Class 5 make a pictogram to show the number of minibeasts they found in their garden. How many ants did Class 5 find?
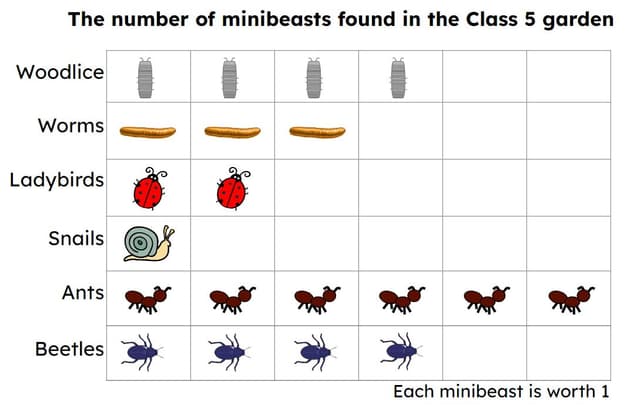
Q2.How many more ants did Class 5 find than ladybirds?
Q3.Class 5 found 2 fewer butterflies than worms. How many butterflies did they find?
Q4.How many woodlice did Class 5 find the following week? (Pay close attention to the key.)
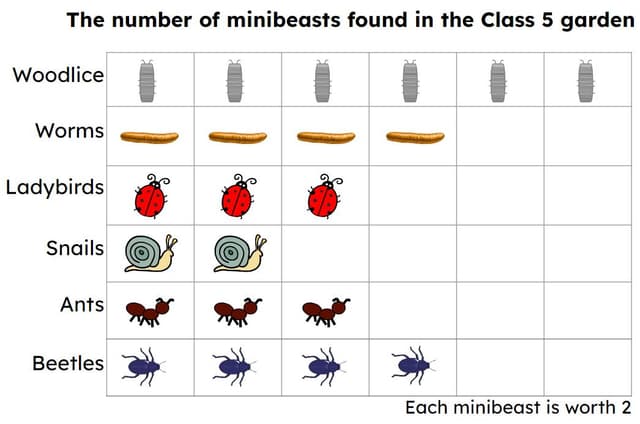
Q5.How many fewer ants did Class 5 find than beetles?
Q6.Class 5 found 2 fewer butterflies than woodlice. How many butterflies did they find?