Myths about teaching can hold you back

- Year 4
Use knowledge of measure conversions to interpret graphs and tables
You can use knowledge of measure conversions to interpret graphs and tables
- Year 4
Use knowledge of measure conversions to interpret graphs and tables
You can use knowledge of measure conversions to interpret graphs and tables
Lesson details
Key learning points
- There are 1,000 g in a kg
- There are 1,000 ml in a l
- There are 1,000 mm in a m
- Information relating to measures such as length and mass can be presented in the form of tables or graphs.
Keywords
Bar graph - A graph drawn using rectangular bars to show how large each value is. The bars can be horizontal or vertical.
Interval - What is in between two values or points. On a bar graph these may be marked using numbers or unmarked.
Common misconception
When reading bar graphs with unmarked intervals, some pupils might assume each interval equals 1. In the case of the graphs presented in this lesson, the intervals go up in 100s, 200s, 250s and 500s.
Encourage children to apply their knowledge of converting a unit into 1,000 (such as 1 litre being converted into 1,000 ml) and then exploring its composition in 2, 4, 5 and 10 equal parts. Check the unmarked intervals by counting in those steps.
To help you plan your year 4 maths lesson on: Use knowledge of measure conversions to interpret graphs and tables, download all teaching resources for free and adapt to suit your pupils' needs...
To help you plan your year 4 maths lesson on: Use knowledge of measure conversions to interpret graphs and tables, download all teaching resources for free and adapt to suit your pupils' needs.
The starter quiz will activate and check your pupils' prior knowledge, with versions available both with and without answers in PDF format.
We use learning cycles to break down learning into key concepts or ideas linked to the learning outcome. Each learning cycle features explanations with checks for understanding and practice tasks with feedback. All of this is found in our slide decks, ready for you to download and edit. The practice tasks are also available as printable worksheets and some lessons have additional materials with extra material you might need for teaching the lesson.
The assessment exit quiz will test your pupils' understanding of the key learning points.
Our video is a tool for planning, showing how other teachers might teach the lesson, offering helpful tips, modelled explanations and inspiration for your own delivery in the classroom. Plus, you can set it as homework or revision for pupils and keep their learning on track by sharing an online pupil version of this lesson.
Explore more key stage 2 maths lessons from the Calculation and conversion of measures unit, dive into the full primary maths curriculum, or learn more about lesson planning.

Licence
Lesson video
Loading...
Prior knowledge starter quiz
6 Questions
Q1.The number line goes from 0 to 1,000 What is each interval worth?
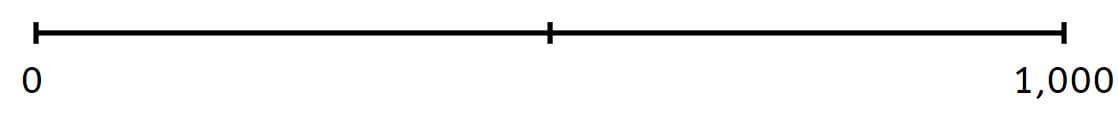
Q2.This number line goes from 0 to 1,000 What is each interval worth?

Q3.This number line goes from 0 to 1,000 What is each interval worth?

Q4.This number line goes from 0 to 1,000 What is each interval worth?

Q5.What number is the midpoint of 200 and 300?
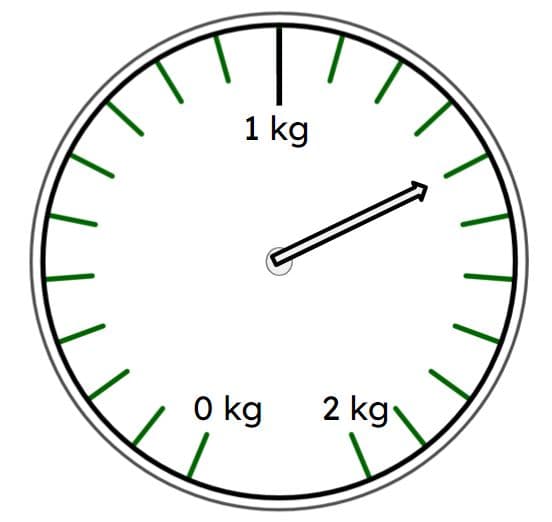
Q6.What value is the arrow pointing to?
Assessment exit quiz
6 Questions
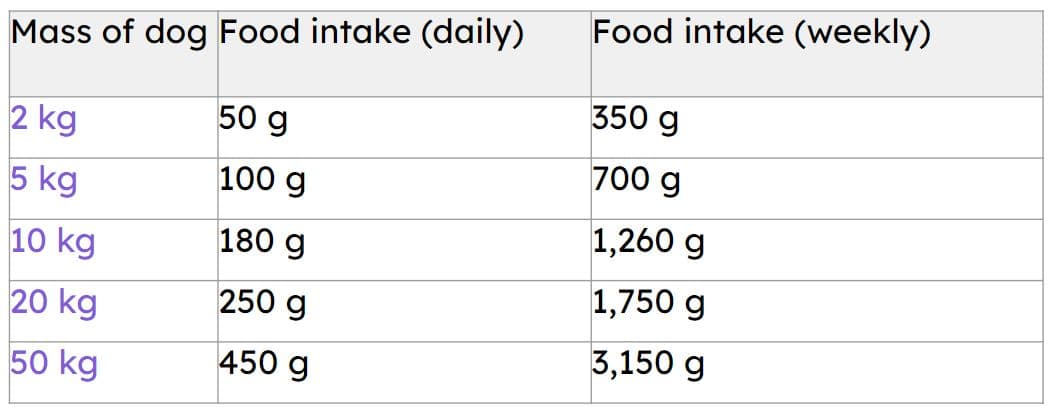
Q1.How much food does a 50 kg dog need each day? g.
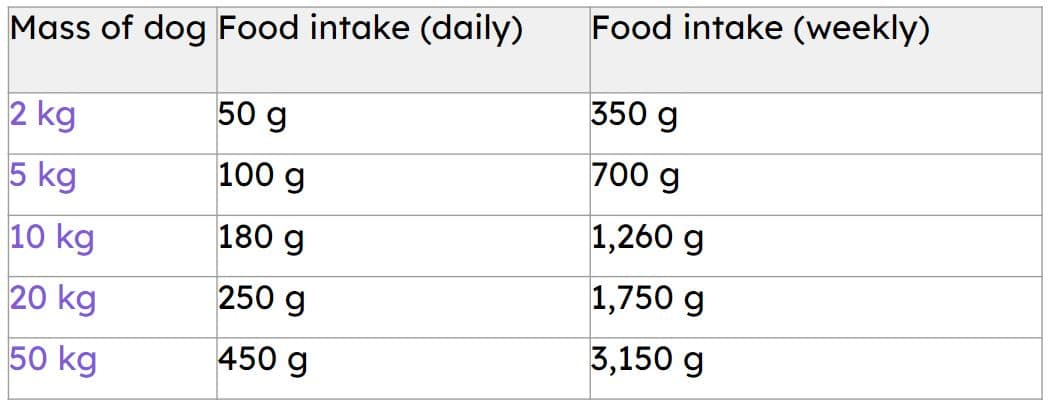
Q2.How much food does a 5 kg dog need in two weeks? g.
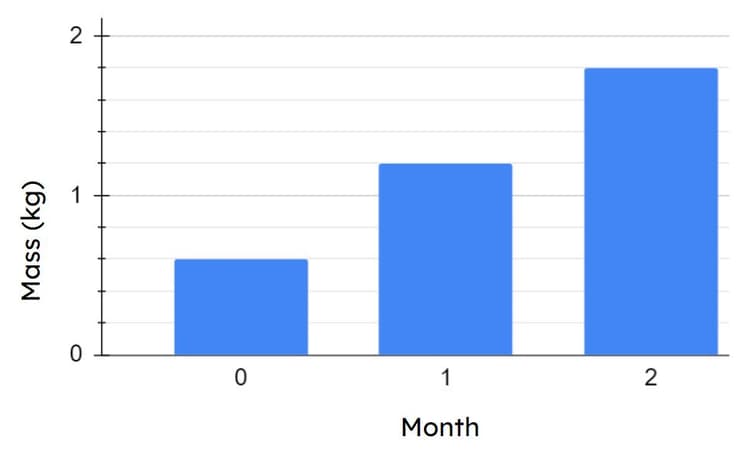
Q3.The graph shows the mass of a dog in different months. What is the mass of the dog when it is two months old? Select all the correct options.
Q4.Which dogs have a height less than 350 mm?
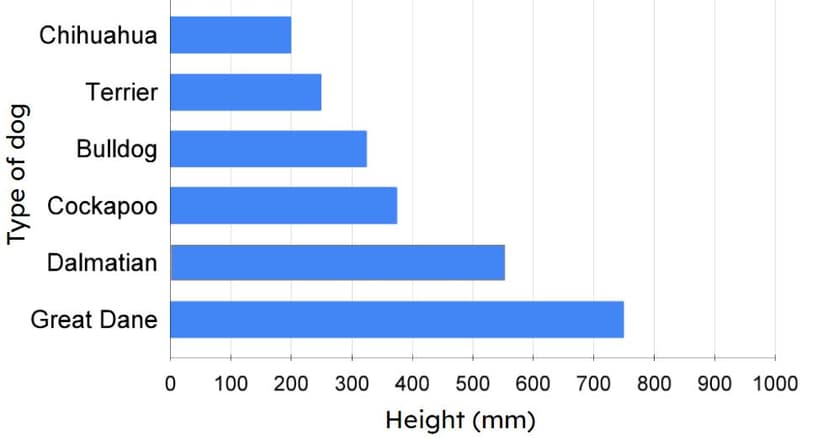
Q5.What is the difference between a Dalmatian’s height and a Great Dane’s height? mm.
Q6.What is the difference between a Chihuahua’s height and a Dalmatian’s height? mm.