Myths about teaching can hold you back

- Year 3
Use addition and subtraction to solve problems involving bar charts, pictograms and tables
I can use addition and subtraction to solve problems involving bar charts, pictograms and tables.
- Year 3
Use addition and subtraction to solve problems involving bar charts, pictograms and tables
I can use addition and subtraction to solve problems involving bar charts, pictograms and tables.
Lesson details
Key learning points
- By looking carefully at the numbers involved, you can choose the most efficient strategy.
- When numbers are close together, finding the difference is the most efficient strategy.
- Sometimes, we can use known addition facts to make finding the difference even more efficient.
Keywords
Bar chart - A bar chart uses rectangular bars to show different values.
Pictogram - A pictogram is a graph that uses pictures to represent information.
Table - A table has information arranged in rows and columns.
Common misconception
Children can often be overwhelmed by the amount of visual data they are presented with.
Expose children to graphical data as much as possible outside of maths lessons. Encourage children to make simple bar charts with cubes so they understand their formation and liken the searching for specific values to search and find books.
To help you plan your year 3 maths lesson on: Use addition and subtraction to solve problems involving bar charts, pictograms and tables, download all teaching resources for free and adapt to suit your pupils' needs...
To help you plan your year 3 maths lesson on: Use addition and subtraction to solve problems involving bar charts, pictograms and tables, download all teaching resources for free and adapt to suit your pupils' needs.
The starter quiz will activate and check your pupils' prior knowledge, with versions available both with and without answers in PDF format.
We use learning cycles to break down learning into key concepts or ideas linked to the learning outcome. Each learning cycle features explanations with checks for understanding and practice tasks with feedback. All of this is found in our slide decks, ready for you to download and edit. The practice tasks are also available as printable worksheets and some lessons have additional materials with extra material you might need for teaching the lesson.
The assessment exit quiz will test your pupils' understanding of the key learning points.
Our video is a tool for planning, showing how other teachers might teach the lesson, offering helpful tips, modelled explanations and inspiration for your own delivery in the classroom. Plus, you can set it as homework or revision for pupils and keep their learning on track by sharing an online pupil version of this lesson.
Explore more key stage 2 maths lessons from the Informal and mental strategies for adding and subtracting two 3-digit numbers unit, dive into the full primary maths curriculum, or learn more about lesson planning.

Licence
Lesson video
Loading...
Prior knowledge starter quiz
6 Questions
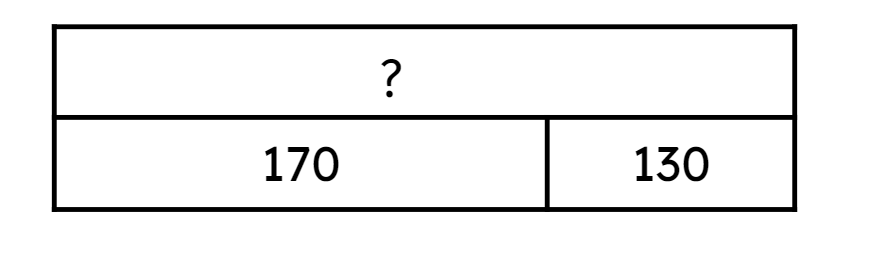
Q1.What is the missing whole in this bar model?
Q2.What is the difference between the two values shown?
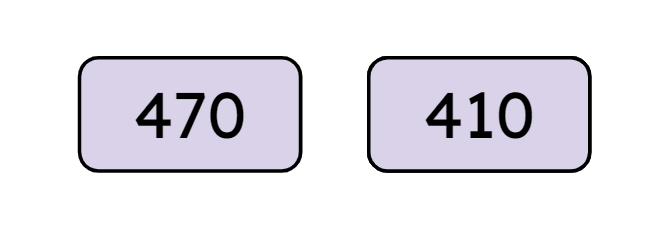
Q3.Which of the pairs of numbers have a difference of 30?
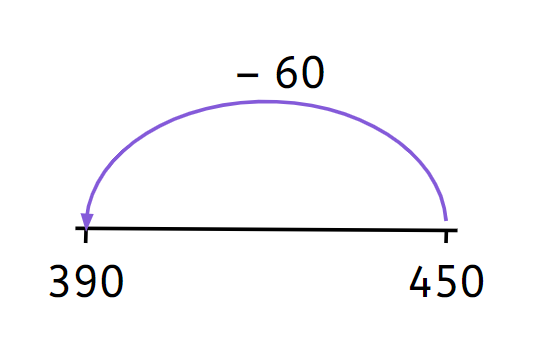
Q4.Which of these is the correct equation represented by this number line?
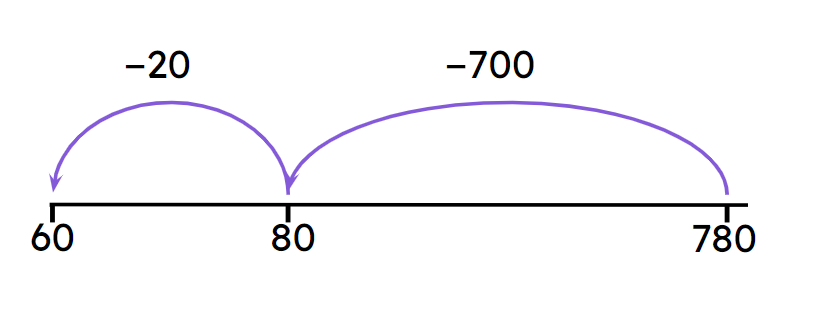
Q5.Look at the number line. Which number is missing from the equation? 780 − = 60
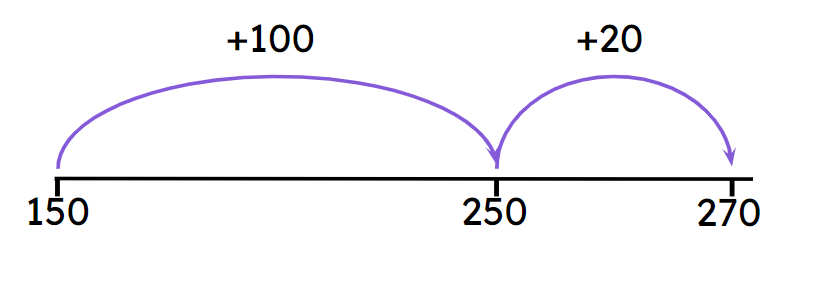
Q6.Look at the number line. Which number is missing from the equation? + 120 = 270
Assessment exit quiz
6 Questions
Q1.Which type of graphical data is being described here: a graph that uses pictures to represent information?
Q2.What is the combined mass of the sun bear and panda bear? kg
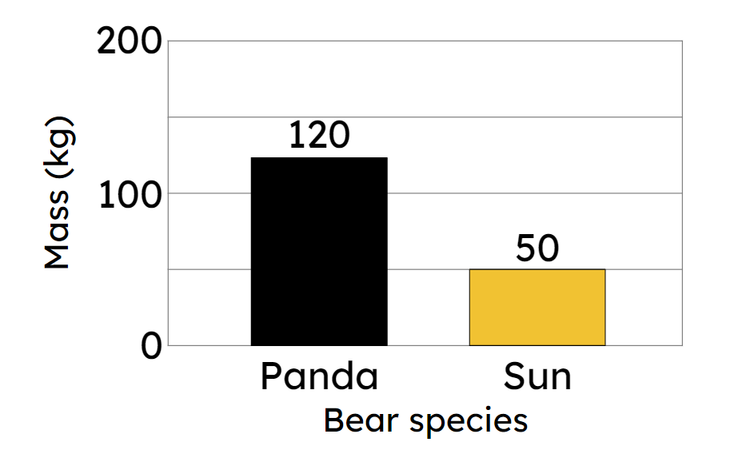
Q3.What is the difference in mass between the sun bear and panda bear? kg
Q4.Jun and Alex play a computer game and score points. Their scores are shown in the pictogram below. A full emoji represents 100 points, a half emoji represents 50 points. Which are the correct scores?
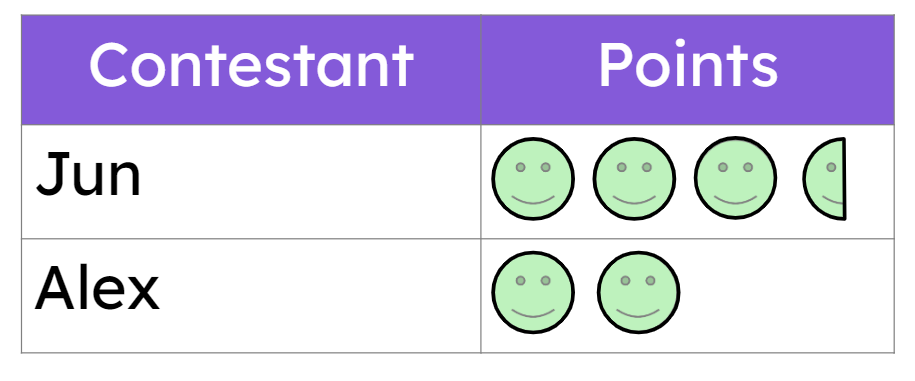
Q5.Jun and Alex play a computer game and score points. Their scores are shown in the pictogram below. A full emoji represents 100 points, a half emoji represents 50 points. How much did Jun win by?
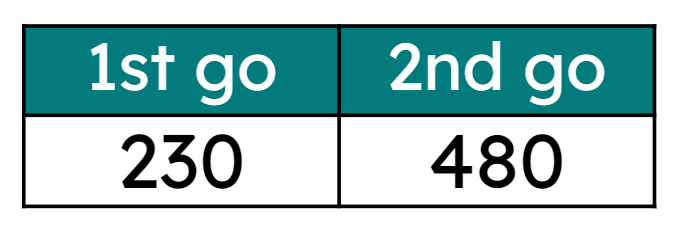
Q6.The table below shows the scores over two goes for Alex in a netball shooting game. What was the combined total of both goes?