Myths about teaching can hold you back

- Year 6
Read the scales of graphs and measures using knowledge of the composition of 10,000 and 100,000
I can read the scales of graphs and measures using knowledge of the composition of 10,000 and 100,000
- Year 6
Read the scales of graphs and measures using knowledge of the composition of 10,000 and 100,000
I can read the scales of graphs and measures using knowledge of the composition of 10,000 and 100,000
Lesson details
Key learning points
- Measuring scales can be interpreted by counting in steps of 1,000, 2,000, 2,500 and 5,000
- Measuring scales can be interpreted by counting in steps of 10,000, 20,000, 25,00 and 50,000
- Graph scales can be read and interpreted by counting in multiples of 1,000 and 10,000
Keywords
Multiple - A multiple is the result of multiplying a number by an integer (not by a fraction).
Gridlines - A gridline is a horizontal or vertical line that helps organise data on a graph or graph.
Common misconception
Pupils struggle to create axis for their graphs that have equal intervals.
You could spend some time with pupils simply practising drawing each axis. Ensure pupils do not draw a line and then try to divide into equal intervals. Instead encourage marking the intervals as the line is drawn.
To help you plan your year 6 maths lesson on: Read the scales of graphs and measures using knowledge of the composition of 10,000 and 100,000, download all teaching resources for free and adapt to suit your pupils' needs...
To help you plan your year 6 maths lesson on: Read the scales of graphs and measures using knowledge of the composition of 10,000 and 100,000, download all teaching resources for free and adapt to suit your pupils' needs.
The starter quiz will activate and check your pupils' prior knowledge, with versions available both with and without answers in PDF format.
We use learning cycles to break down learning into key concepts or ideas linked to the learning outcome. Each learning cycle features explanations with checks for understanding and practice tasks with feedback. All of this is found in our slide decks, ready for you to download and edit. The practice tasks are also available as printable worksheets and some lessons have additional materials with extra material you might need for teaching the lesson.
The assessment exit quiz will test your pupils' understanding of the key learning points.
Our video is a tool for planning, showing how other teachers might teach the lesson, offering helpful tips, modelled explanations and inspiration for your own delivery in the classroom. Plus, you can set it as homework or revision for pupils and keep their learning on track by sharing an online pupil version of this lesson.
Explore more key stage 2 maths lessons from the Multiples of 1,000 unit, dive into the full primary maths curriculum, or learn more about lesson planning.

Licence
Lesson video
Loading...
Prior knowledge starter quiz
6 Questions
Q1.Write the following number using digits. Remember to use comma separators accurately. Seventy six thousand and forty five.
Q2.Complete the sentence: There are 1,000 __________ in ten thousand.
Q3.Give the missing number in the sequence. 60,000 80,000 100,000 120,000
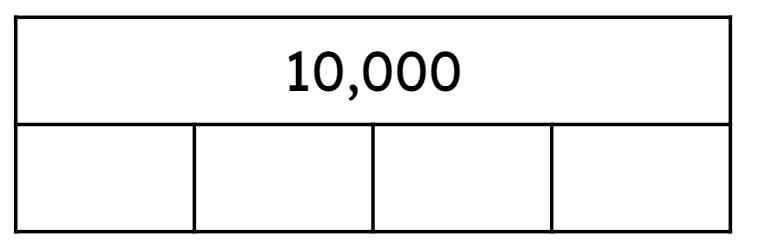
Q4.What is the value of each part in the bar model?
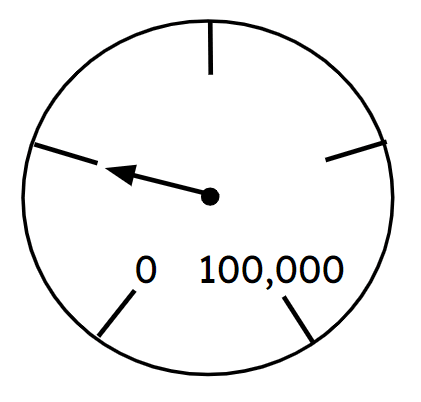
Q5.Give the value that the arrow is pointing to.
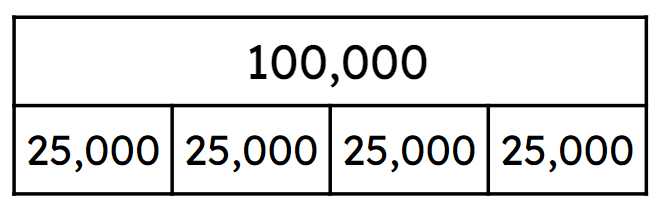
Q6.Tick the equation that matches this bar model.
Assessment exit quiz
6 Questions
Q1.Tick the situations when it would be best to overestimate.
Q2.Titles should be written on a bar graph for:
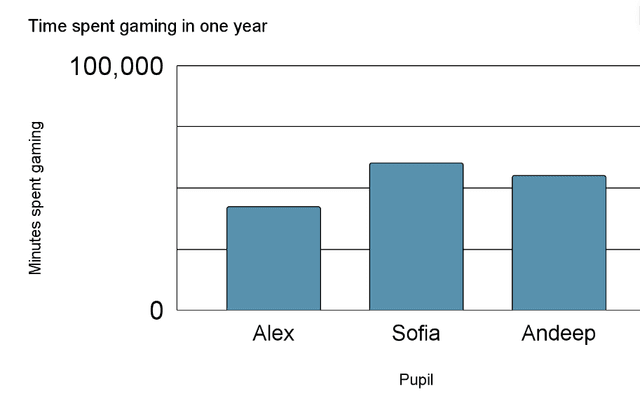
Q3.Tick the best estimate for the time Alex spent gaming.
Q4.It is better to draw a y-axis with:
Q5.Tick the best estimate for the time Sofia spent gaming.
Q6.Tick the best estimate for the time Andeep spent gaming.