Myths about teaching can hold you back

- Year 5
Use knowledge of positive and negative numbers to interpret graphs
I can use knowledge of positive and negative numbers to interpret graphs.
- Year 5
Use knowledge of positive and negative numbers to interpret graphs
I can use knowledge of positive and negative numbers to interpret graphs.
Lesson details
Key learning points
- Negative data values can be recorded by extending the axes beyond zero
Keywords
Axis / axes - The x and y lines that cross at right angles to make a graph or grid.
Common misconception
Inaccuracy when reading horizontally from the top of a bar to the y axis on a bar chart.
Model and encourage the use of rulers to follow a straight horizontal line from the top of a bar to the y axis.
To help you plan your year 5 maths lesson on: Use knowledge of positive and negative numbers to interpret graphs, download all teaching resources for free and adapt to suit your pupils' needs...
To help you plan your year 5 maths lesson on: Use knowledge of positive and negative numbers to interpret graphs, download all teaching resources for free and adapt to suit your pupils' needs.
The starter quiz will activate and check your pupils' prior knowledge, with versions available both with and without answers in PDF format.
We use learning cycles to break down learning into key concepts or ideas linked to the learning outcome. Each learning cycle features explanations with checks for understanding and practice tasks with feedback. All of this is found in our slide decks, ready for you to download and edit. The practice tasks are also available as printable worksheets and some lessons have additional materials with extra material you might need for teaching the lesson.
The assessment exit quiz will test your pupils' understanding of the key learning points.
Our video is a tool for planning, showing how other teachers might teach the lesson, offering helpful tips, modelled explanations and inspiration for your own delivery in the classroom. Plus, you can set it as homework or revision for pupils and keep their learning on track by sharing an online pupil version of this lesson.
Explore more key stage 2 maths lessons from the Negative numbers unit, dive into the full primary maths curriculum, or learn more about lesson planning.

Licence
Lesson video
Loading...
Prior knowledge starter quiz
6 Questions
Q1.Match the keyword with the definition.
the plural of axis
the horizontal line on a coordinate grid or graph
the vertical line on a coordinate grid or graph
Q2.A number line showing positive and negative values has marked intervals going up and down in twos. Which of the following numbers would appear as a marked interval?
Q3.A number line showing positive and negative values has marked intervals going up and down in fives. Which of the following numbers would not appear in between the marked intervals?
Q4.Fill in the gap: 20, 15, 10, 5, 0, , −10
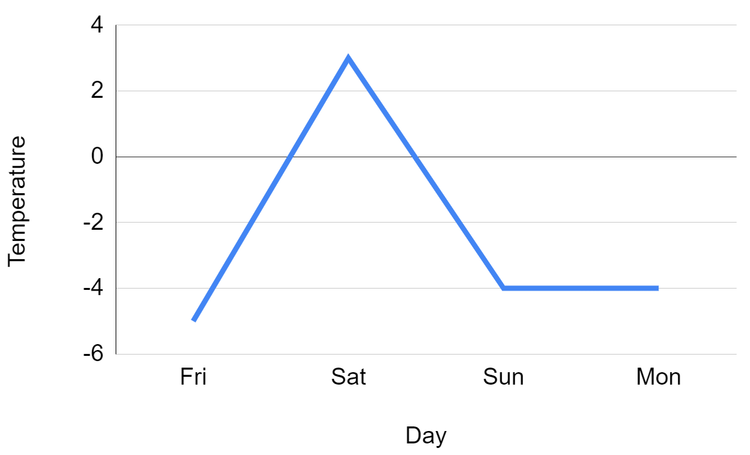
Q5.Tick all of the statements that are true of this graph.
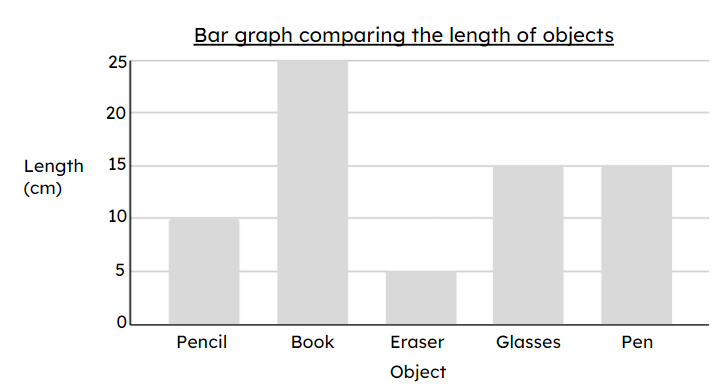
Q6.What is the difference between the length of the pencil and the length of the book? cm
Assessment exit quiz
6 Questions
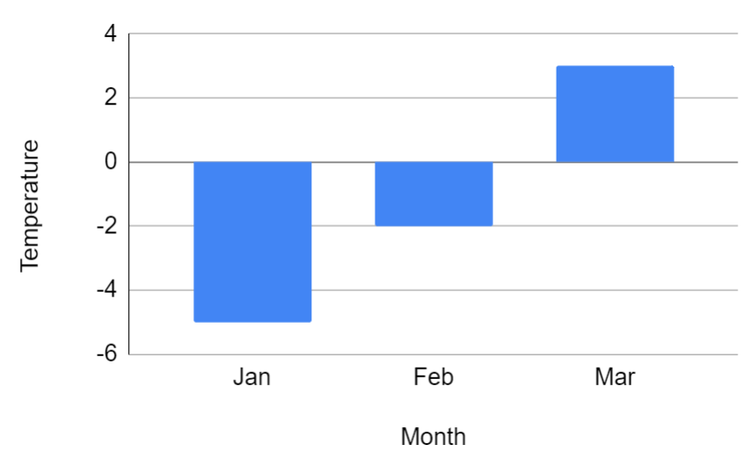
Q1.The graph shows the average monthly temperature in the first three months of the year in ℃. What is the temperature in January? ℃

Q2.What is the difference between the temperature in January and the temperature in February? ℃
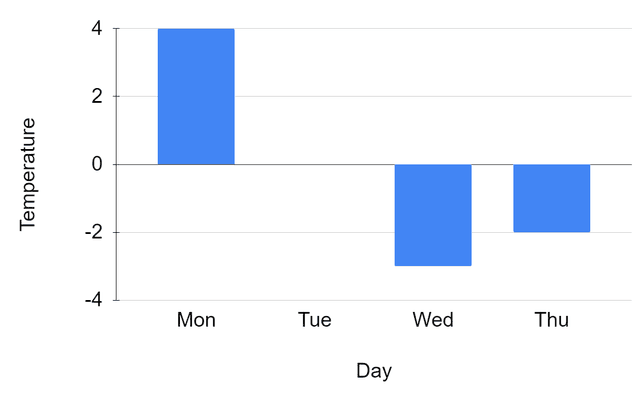
Q3.This graph shows the minimum temperatures in degrees Celsius on different days of the week. What is the difference between the highest and lowest temperatures? ℃
Q4.Tick all the statements that are true.
Q5.In a line graph showing temperatures, what would the different orientations of the line mean? Match the type of line with the description of what it shows.
Temperature increases
Temperature remains the same
Temperature decreases
Q6.This graph shows the changes in temperature over several days in ℃. Tick all the statements that are true.