Myths about teaching can hold you back

- Year 6
Construct line graphs representing two variables in familiar contexts
I can construct line graphs representing two variables.
- Year 6
Construct line graphs representing two variables in familiar contexts
I can construct line graphs representing two variables.
Lesson details
Key learning points
- A line graph is a way of representing the relationship between two variables.
- One variable is represented by the x-axis and the other, by the y-axis.
- Points are plotted like coordinates with a value on the x-axis and a value on the y-axis.
Keywords
Line graph - A line graph is a graph where the points are connected by lines. It shows how something changes in value, usually over time.
Variable - A variable is something that changes and can also be measured.
X-axis - The x-axis is the horizontal line on a graph which goes through zero.
Y-axis - The y-axis is the vertical line on a graph which goes through zero.
Common misconception
Pupils may not understand that line graphs are only used for continuous data, where the points between those that are plotted have meaning.
Show children examples of graphs where there is no meaning between divisions on the x-axis (e.g. heights of children). Here, the points cannot be joined to make a line graph.
To help you plan your year 6 maths lesson on: Construct line graphs representing two variables in familiar contexts, download all teaching resources for free and adapt to suit your pupils' needs...
To help you plan your year 6 maths lesson on: Construct line graphs representing two variables in familiar contexts, download all teaching resources for free and adapt to suit your pupils' needs.
The starter quiz will activate and check your pupils' prior knowledge, with versions available both with and without answers in PDF format.
We use learning cycles to break down learning into key concepts or ideas linked to the learning outcome. Each learning cycle features explanations with checks for understanding and practice tasks with feedback. All of this is found in our slide decks, ready for you to download and edit. The practice tasks are also available as printable worksheets and some lessons have additional materials with extra material you might need for teaching the lesson.
The assessment exit quiz will test your pupils' understanding of the key learning points.
Our video is a tool for planning, showing how other teachers might teach the lesson, offering helpful tips, modelled explanations and inspiration for your own delivery in the classroom. Plus, you can set it as homework or revision for pupils and keep their learning on track by sharing an online pupil version of this lesson.
Explore more key stage 2 maths lessons from the Statistics unit, dive into the full primary maths curriculum, or learn more about lesson planning.

Licence
Lesson video
Loading...
Prior knowledge starter quiz
6 Questions
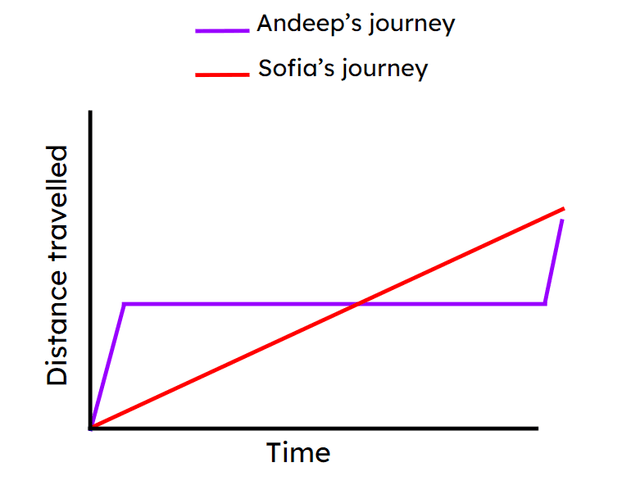
Q1.True or false: Andeep spends more time travelling than resting according to the data in the graph.
Q2.Jacob is counting backwards in steps of 5, from 10: 10, 5, 0, ___ What will he say next?
Q3.Jun measured the sunflower and it was 30 cm tall. When did he measure it?
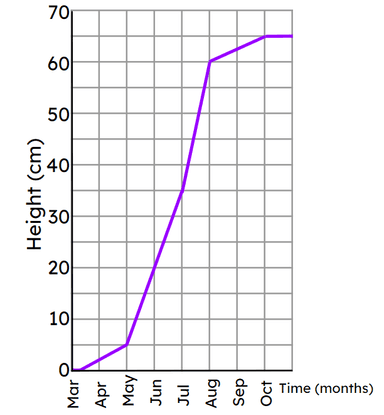
Q4.During which month did the sunflower not grow at all?
Q5.How much did the sunflower grow during June? cm
Q6.During which month did the sunflower grow most quickly?
Assessment exit quiz
6 Questions
Q1.Which of the following would not be recorded on a line graph?
Q2.The line graph shows how the temperature changes between the hours of 8 am and 7 pm. What was the hottest time of the day?

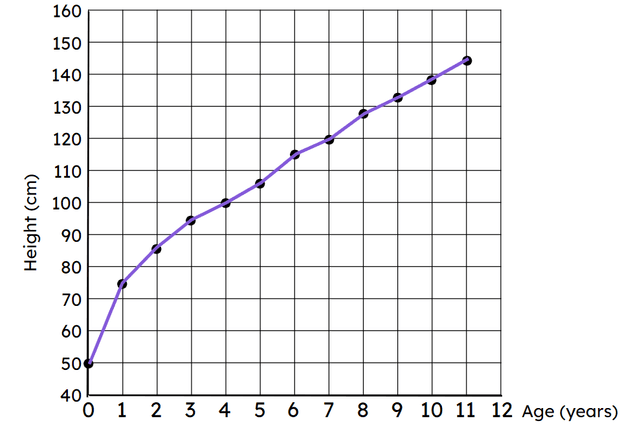
Q3.This line graph shows how Izzy’s height has changed as she has grown. Use the line graph to estimate her height when she was 6 years old. cm
Q4.This line graph shows the distance of each child from school. At 8:40 am, which child was the closest to school?
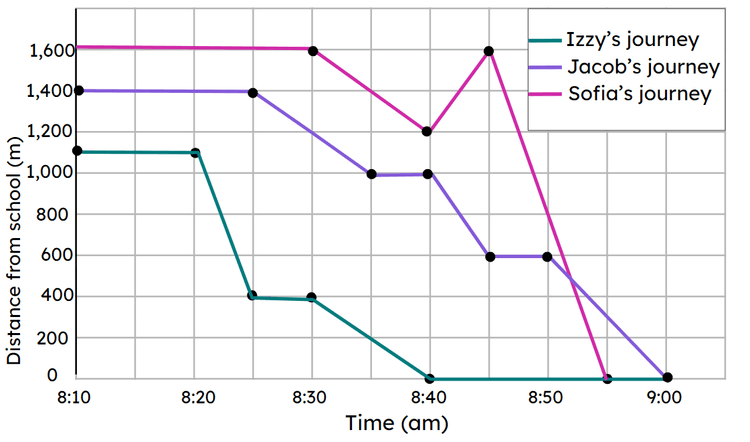
Q5.Use the line graph to find out how much closer Jacob was to the school than Sofia at 8:40am. m
Q6.How many metres did Izzy travel altogether on her journey? m