Myths about teaching can hold you back

- Year 6
Interpret line graphs representing two variables in familiar contexts
I can interpret line graphs representing two variables.
- Year 6
Interpret line graphs representing two variables in familiar contexts
I can interpret line graphs representing two variables.
Lesson details
Key learning points
- A line graph is a way of representing the relationship between two variables.
- One variable is represented by the x-axis and the other by the y-axis.
- Points are plotted like coordinates with a value on the x-axis and a value on the y-axis.
Keywords
Line graph - A line graph is a graph where the points are connected by lines. It shows how something changes in value, usually over time.
Variable - A variable is something that changes and can also be measured.
X-axis - The x-axis is the horizontal line on a graph which goes through zero.
Y-axis - The y-axis is the vertical line on a graph which goes through zero.
Common misconception
Pupils may not understand that line graphs are only used for continuous data, where the points between those that are plotted have meaning.
Show children examples of graphs where there is no meaning between divisions on the x-axis (e.g. heights of children). Here, the points cannot be joined to make a line graph.
To help you plan your year 6 maths lesson on: Interpret line graphs representing two variables in familiar contexts, download all teaching resources for free and adapt to suit your pupils' needs...
To help you plan your year 6 maths lesson on: Interpret line graphs representing two variables in familiar contexts, download all teaching resources for free and adapt to suit your pupils' needs.
The starter quiz will activate and check your pupils' prior knowledge, with versions available both with and without answers in PDF format.
We use learning cycles to break down learning into key concepts or ideas linked to the learning outcome. Each learning cycle features explanations with checks for understanding and practice tasks with feedback. All of this is found in our slide decks, ready for you to download and edit. The practice tasks are also available as printable worksheets and some lessons have additional materials with extra material you might need for teaching the lesson.
The assessment exit quiz will test your pupils' understanding of the key learning points.
Our video is a tool for planning, showing how other teachers might teach the lesson, offering helpful tips, modelled explanations and inspiration for your own delivery in the classroom. Plus, you can set it as homework or revision for pupils and keep their learning on track by sharing an online pupil version of this lesson.
Explore more key stage 2 maths lessons from the Statistics unit, dive into the full primary maths curriculum, or learn more about lesson planning.

Licence
Lesson video
Loading...
Prior knowledge starter quiz
6 Questions
Q1.Jun spotted 40 birds over the week in his garden. 8 of them were blackbirds. What percentage of the birds seen are blackbirds? %
Q2.Match the time to the written version.
5 minutes to 8
25 minutes to 9
10 minutes to 7
Q3.What is the number halfway between 42 and 62? is half way between 42 and 62
Q4.Jun’s sweets have a mass of 75 grams. Sam’s sweets have a mass of 32 grams. How many more grams of sweets does Jun have? Jun has more grams of sweets than Sam.
Q5.Jun has two drinks. He has 432 millilitres of orange juice and 213 millilitres of blackcurrant. How much more orange juice than blackcurrant does Jun have? ml
Q6.Jun and Sam want to buy some sweets. Jun has £1.12 and Sam has £1.63 How much money do they have in total and how much more money does Sam have than Jun?
Assessment exit quiz
6 Questions
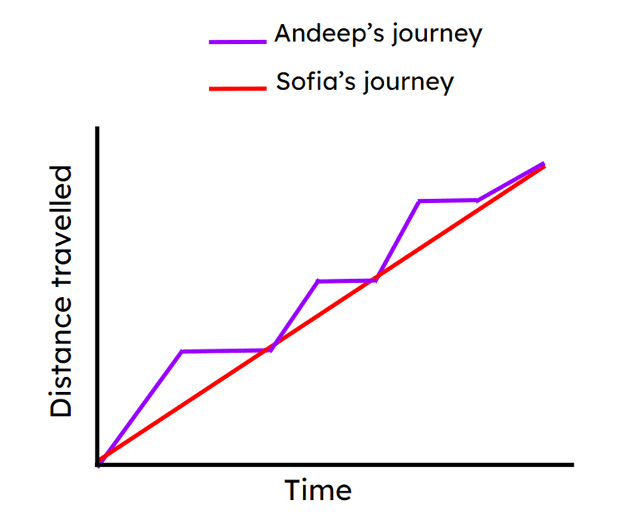
Q1.Look at the graph. How many times does Andeep stop on his journey?
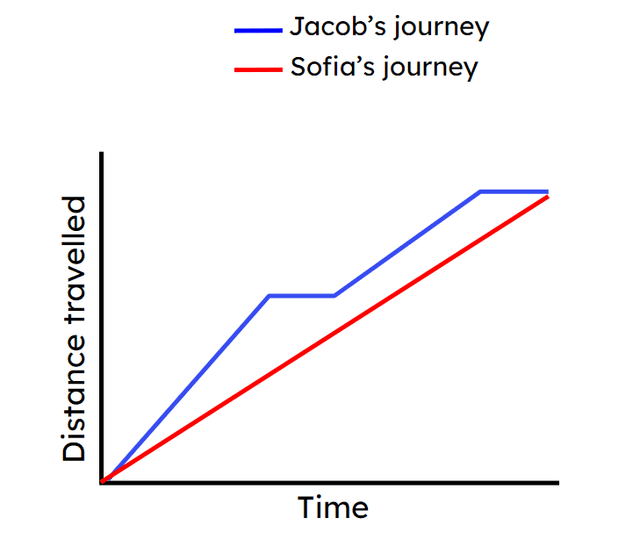
Q2.Jacob and Sofia meet at the park for a picnic. The graph shows their journey from start to end. Tick the statements that are true.
Q3.Sofia is doing a sponsored walk. The line graph shows the distance she travelled over the afternoon. What time did she set off? Give your answer using 24-hour time format.
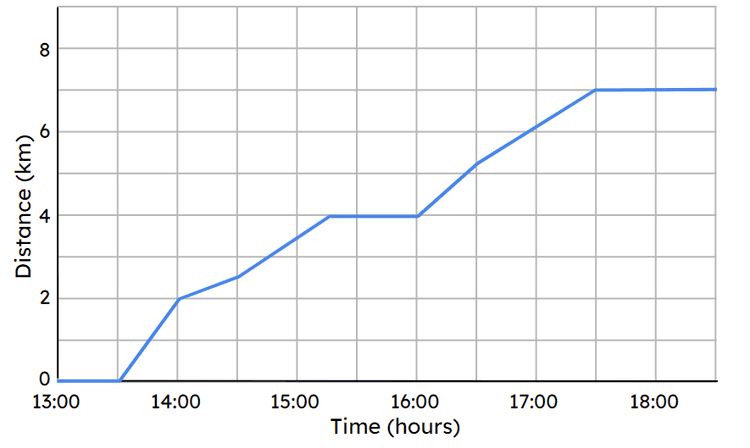
Q4.Sofia is doing a sponsored walk. The line graph shows the distance she travelled over the afternoon. How many km had she covered by the end of the walk? km
Q5.Estimate at what time during the journey Sofia stopped for her first rest.
Q6.Look at the graph. In which time period did Sofia travel the fastest?