Myths about teaching can hold you back

- Year 8
Problem solving with graphical representations of data
I can use my understanding of various graphical representations to solve problems.
- Year 8
Problem solving with graphical representations of data
I can use my understanding of various graphical representations to solve problems.
Lesson details
Key learning points
- Data can be presented in various formats.
- A fuller picture can be obtained when considering more data.
- Multiple representations may be unnecessary.
Keywords
Bar chart - A bar chart (bar graph) is a graph consisting of bars visually representing the frequency of objects or groups.
Pie chart - A pie chart (pie graph) is a circular graph where sectors represent different groups proportionally.
Scatter graph - A scatter graph is a visual representation for bivariate data. It can help determine the nature of the relationship between the variables.
Common misconception
Pupils may think that data is only presented using the types of graphs that they learn in school.
Data can presented visually in anyway that helps people to understand it. Explore other types of graphs and infographics used in the media.
To help you plan your year 8 maths lesson on: Problem solving with graphical representations of data, download all teaching resources for free and adapt to suit your pupils' needs...
To help you plan your year 8 maths lesson on: Problem solving with graphical representations of data, download all teaching resources for free and adapt to suit your pupils' needs.
The starter quiz will activate and check your pupils' prior knowledge, with versions available both with and without answers in PDF format.
We use learning cycles to break down learning into key concepts or ideas linked to the learning outcome. Each learning cycle features explanations with checks for understanding and practice tasks with feedback. All of this is found in our slide decks, ready for you to download and edit. The practice tasks are also available as printable worksheets and some lessons have additional materials with extra material you might need for teaching the lesson.
The assessment exit quiz will test your pupils' understanding of the key learning points.
Our video is a tool for planning, showing how other teachers might teach the lesson, offering helpful tips, modelled explanations and inspiration for your own delivery in the classroom. Plus, you can set it as homework or revision for pupils and keep their learning on track by sharing an online pupil version of this lesson.
Explore more key stage 3 maths lessons from the Graphical representations of data unit, dive into the full secondary maths curriculum, or learn more about lesson planning.

Licence
Lesson video
Loading...
Prior knowledge starter quiz
6 Questions
Q1.Which type of graph uses pictures of objects to visually represent the frequency of objects or groups.
Q2.Which is a circular graph where sectors represent different groups proportionally?
Q3.The is the number of times an event occurs or the number of individuals (people, animals etc.) with some specific property.
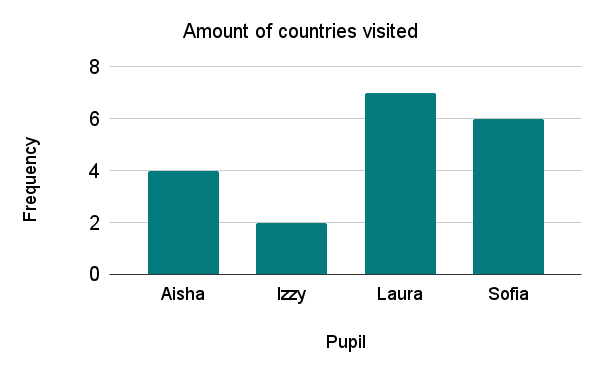
Q4.Look at the bar chart. How many countries has Laura visited?
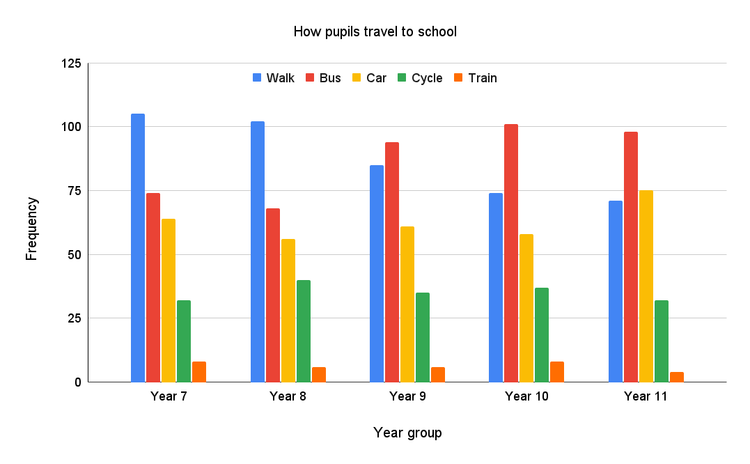
Q5.Look at the bar chart. Which is the most common mode of travel for pupils in Year 10?
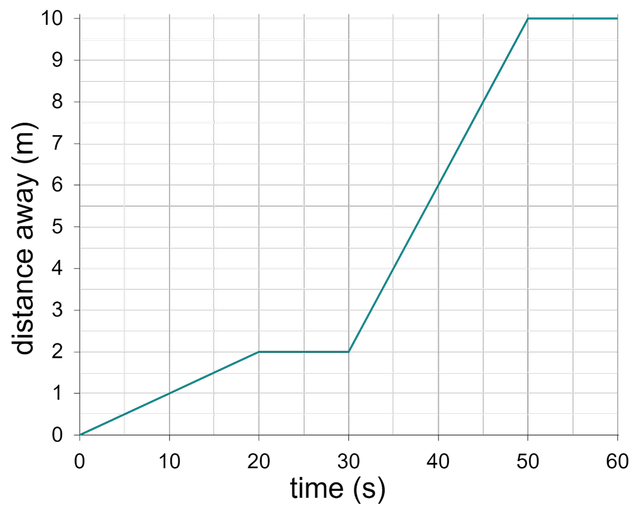
Q6.Look at the line graph. What is the distance at 20 seconds?
Assessment exit quiz
6 Questions
Q1.Which two population pyramids show cases where the number of male and female residents is approximately equal?
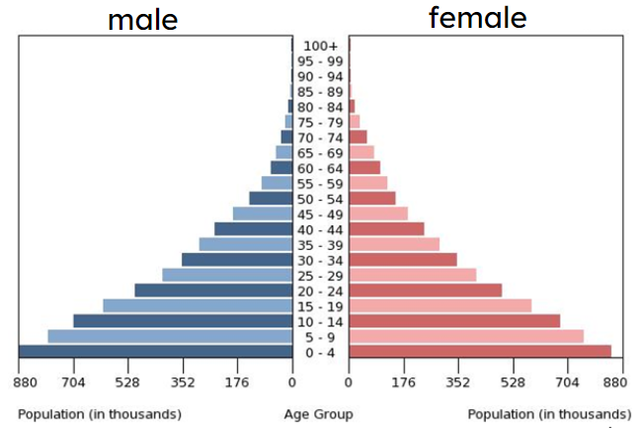
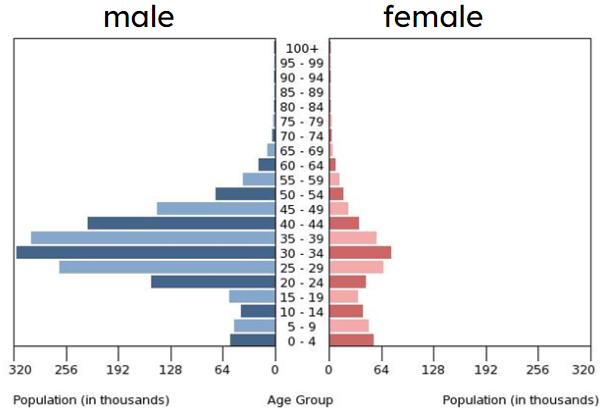
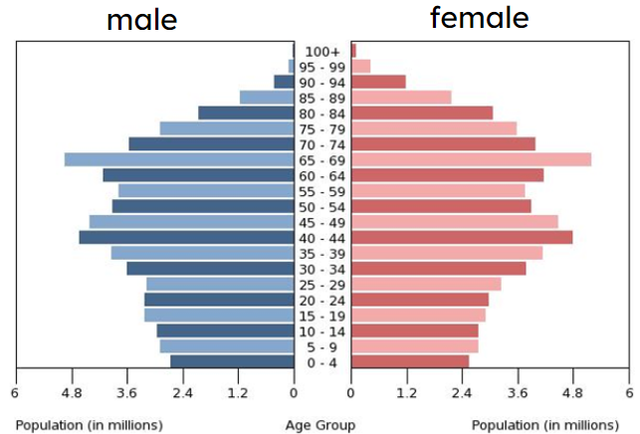
Q2.Which population pyramid shows the population whose largest age group is 30 to 34 year-olds?
Q3.The graphs show average temperature in three towns for each month of the year. Which town is the warmest?
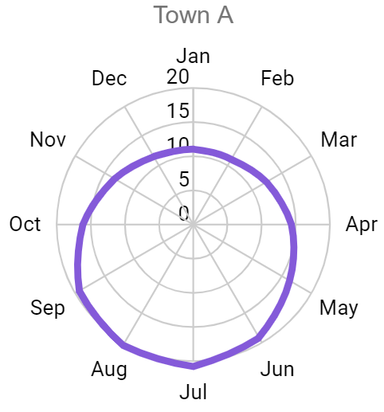
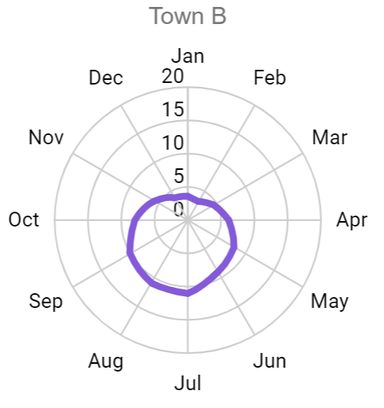
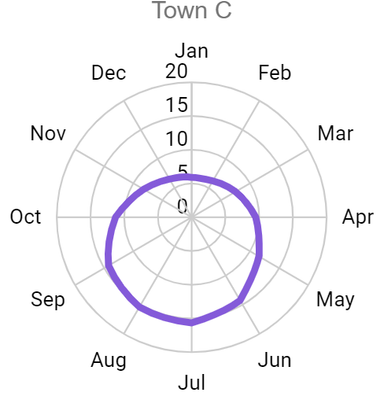
Q4.The graph show the maximum temperature of a town for each month of the year. What was the maximum temperature in April?
Q5.The graph show the maximum temperature of a town for each month of the year. Which town has a mean temperature of 16 degrees Celsius in July?
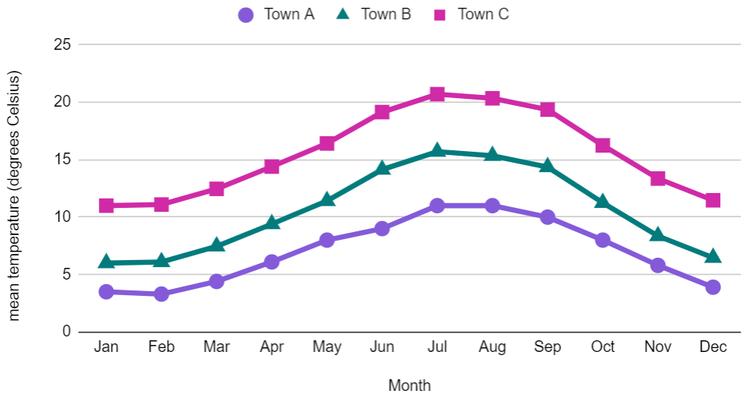
Q6.The graph show the maximum temperature of a town for each month of the year. The mean temperature for Town A in September is degrees Celsius.