New
New
Year 8

Problem solving with graphing linear relationships

I can use my knowledge of graphing linear relationships to solve problems.

New
New
Year 8

Problem solving with graphing linear relationships

I can use my knowledge of graphing linear relationships to solve problems.

Lesson details

Key learning points

  1. Real life relationships can be represented using a linear graph.
  2. Real life problems can be solved using a linear graph.
  3. Switching between algebraic and graphical representations can help solve real life problems.

Common misconception

There is one answer to everything in maths.

We often see arithmetic and equations with one answer but, maths can be used to compare and justify multiple answers to a single problem.

Keywords

  • Rate of change - The rate of change is how one variable changes with respect to another. If constant, there is a linear relationship.

  • Gradient - The gradient is a measure of how steep a line is.

Ask pupils, "If Plumber A charges a $$£50$$ call-out fee and $$£20$$ an hour and Plumber B charges $$£100$$ then $$£10$$ an hour who is cheapest?". Don't interrupt. Let them explore, let them debate. Wait to see who spots the moment they are equal.
Teacher tip

Licence

This content is © Oak National Academy Limited (2024), licensed on Open Government Licence version 3.0 except where otherwise stated. See Oak's terms & conditions (Collection 2).

Loading...

6 Questions

Q1.
The gradient is a measure of how __________ a line is.
Correct answer: steep
high
low
long
Q2.
Which of the values are missing from the table of values for the first five terms of the sequence $$7n-10$$?
An image in a quiz
$$-10$$
Correct answer: $$-3$$
Correct answer: $$4$$
$$7$$
Correct answer: $$18$$
Q3.
A pupil is saving money. They start with $$£30$$ and save $$£8$$ per week. How much will they have after $$5$$ weeks?
Correct Answer: £70, 70
Q4.
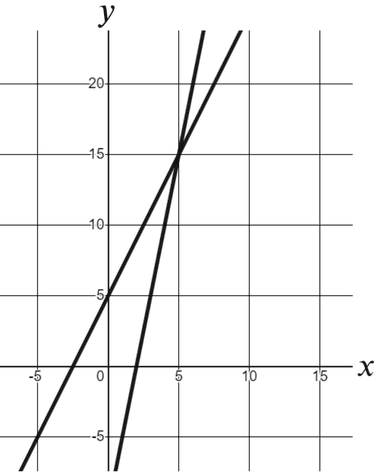
At what coordinates do these two lines intersect?
An image in a quiz
$$(0,5)$$
$$(2,0)$$
Correct answer: $$(5,15)$$
$$(15,5)$$
$$(1,3)$$
Q5.
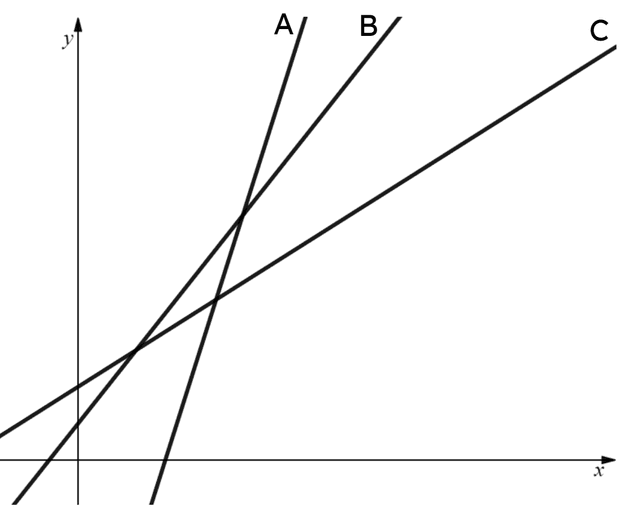
Which of these lines has the steeper gradient?
An image in a quiz
Correct answer: A
B
C
Q6.
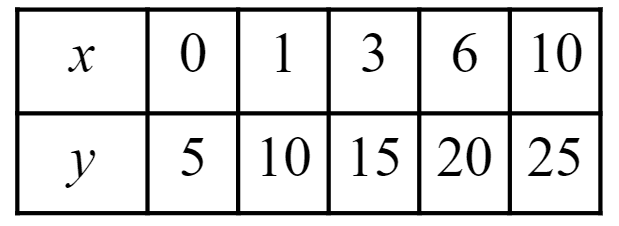
Will this table of values plot a linear relationship?
An image in a quiz
Yes. The $$y$$ values have a constant difference of $$+5$$.
Correct answer: No. Both variables are not changing at a constant rate.
It's impossible to tell until plotted.

6 Questions

Q1.
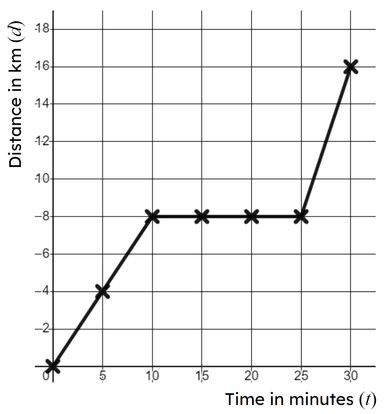
On a time distance graph a greater speed is represented by a steeper .
Correct Answer: gradient
Q2.
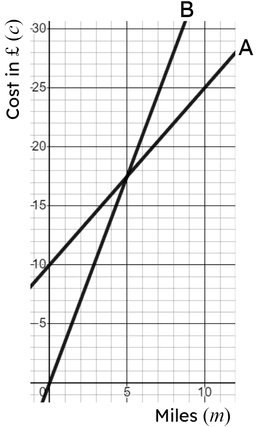
The graph shows the cost of two taxi companies for miles travelled. Which firm is cheapest for a $$3$$ mile journey?
An image in a quiz
A
Correct answer: B
They cost the same price for that many miles.
It's impossible to tell from the graph.
Q3.
The graph shows the cost of two taxi companies for miles travelled. At how many miles do they cost the same price?
An image in a quiz
Correct Answer: 5, five
Q4.
The graph shows the cost of two taxi companies for miles travelled. How much do firm A charge per mile in $$£$$?
An image in a quiz
Correct Answer: 1.50, £1.50, 1.5
Q5.
This graph shows the time $$(t)$$ and distance $$(d)$$ of a car journey. For how long did the car stop?
An image in a quiz
$$8$$ minutes
$$10$$ minutes
Correct answer: $$15$$ minutes
$$25$$ minutes
$$30$$ minutes
Q6.
This graph shows the time $$(t)$$ and distance $$(d)$$ of a car journey. When is the car moving fastest?
An image in a quiz
$$0$$ to $$10$$ minutes
$$10$$ to $$25$$ minutes
Correct answer: $$25$$ to $$30$$ minutes
$$0$$ to $$8$$ kilometres
Correct answer: $$8$$ to $$16$$ kilometres