Myths about teaching can hold you back

- Year 9
Modelling with graphs
I can model real-life situations graphically.
Lesson details
Key learning points
- Distance-time graphs tell you how far you have travelled over a period of time.
- By reading the graph, you can tell if there is mistake with it.
- You can sketch a graph based on the information you have been given.
- Important given values should be marked on your sketch.
Keywords
Rate of change - The rate of change is how quickly one variable changes in relation to another.
Gradient - The gradient is a measure of how steep a line is, calculated by finding the rate of change in the $$y$$-direction with respect to the positive $$x$$-direction.
Common misconception
The line on a distance time graph can go in any direction.
The line may be horizontal, time changing without a change in distance, but it can not be vertical. That would be a change in distance without a change in time. Additionally, our line cannot go backwards; time is always moving forwards.
To help you plan your year 9 maths lesson on: Modelling with graphs, download all teaching resources for free and adapt to suit your pupils' needs...
To help you plan your year 9 maths lesson on: Modelling with graphs, download all teaching resources for free and adapt to suit your pupils' needs.
The starter quiz will activate and check your pupils' prior knowledge, with versions available both with and without answers in PDF format.
We use learning cycles to break down learning into key concepts or ideas linked to the learning outcome. Each learning cycle features explanations with checks for understanding and practice tasks with feedback. All of this is found in our slide decks, ready for you to download and edit. The practice tasks are also available as printable worksheets and some lessons have additional materials with extra material you might need for teaching the lesson.
The assessment exit quiz will test your pupils' understanding of the key learning points.
Our video is a tool for planning, showing how other teachers might teach the lesson, offering helpful tips, modelled explanations and inspiration for your own delivery in the classroom. Plus, you can set it as homework or revision for pupils and keep their learning on track by sharing an online pupil version of this lesson.
Explore more key stage 3 maths lessons from the Graphical representations unit, dive into the full secondary maths curriculum, or learn more about lesson planning.

Licence
Lesson video
Loading...
Prior knowledge starter quiz
6 Questions
Q1.The of change is how quickly one variable changes in relation to another.
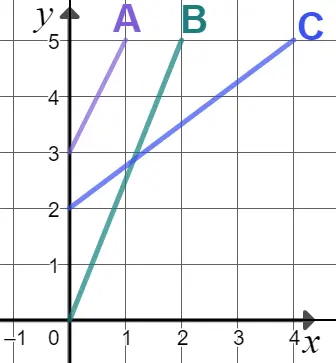
Q2.Which of these lines has the steepest gradient?
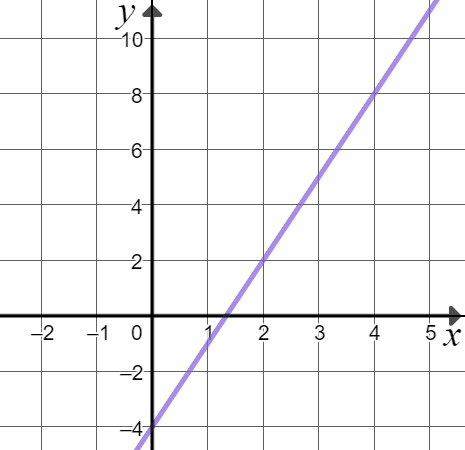
Q3.Look at this graph. What is the value of $$x$$ when $$y=5$$?
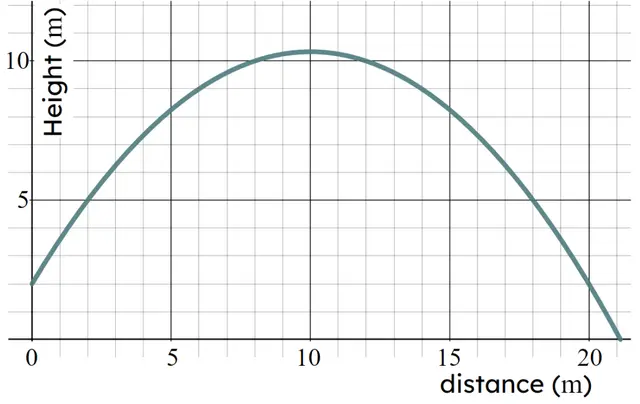
Q4.This parabola models the flight of a cricket ball being thrown. Estimate the maximum height of the cricket ball.
Q5.Laura is plotting the graph of the line $$3y + 4x=12$$. She only wants to plot two points. Which of these points would be the best points for Laura to use?
Q6.Jun wants to draw the graph of $$y = 0.4x + 3.2$$ for positive values of $$x$$. The coordinates of the first point on the line that has positive integer coordinates are .
Assessment exit quiz
6 Questions
Q1.The is a measure of how steep a line is.
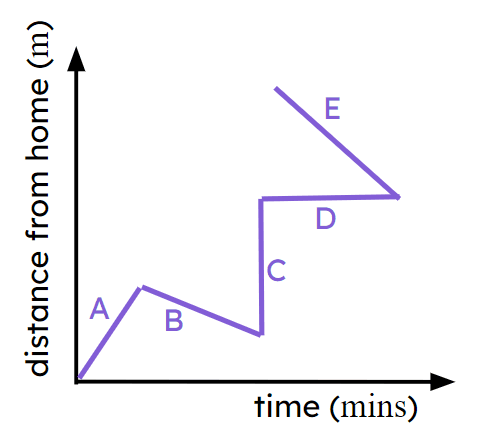
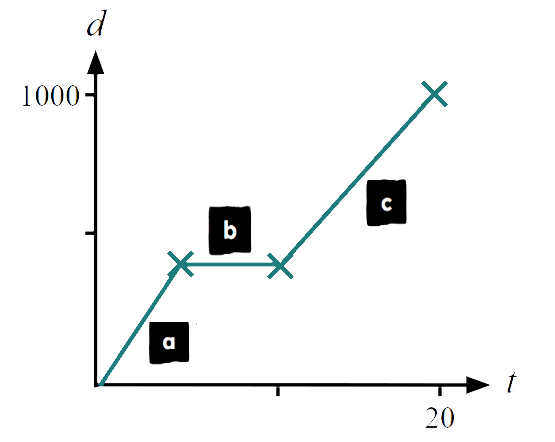
Q2.The distance-time graph shows Sofia's journey to a friend's house. $$d$$ is the distance in metres and $$t$$ is the time in minutes. Which part of the journey is Sofia moving at the greatest speed?
Q3.The distance-time graph shows Andeep's journey to the shops. $$d$$ is the distance in metres from Andeep's house and $$t$$ is the time in minutes. Altogether Andeep's journey takes minutes.
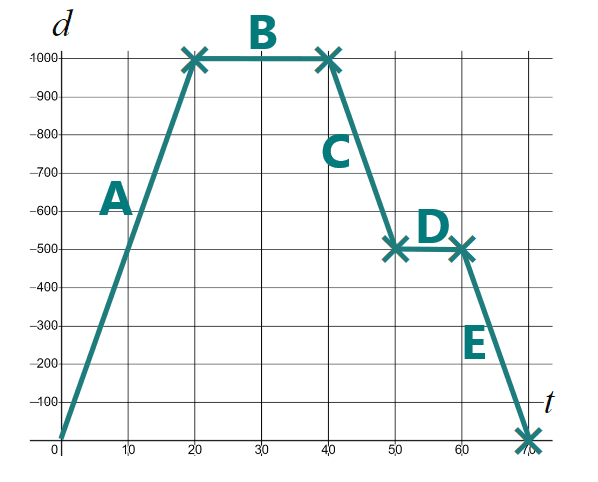
Q4.The distance-time graph shows Andeep's journey to the shops. $$d$$ is the distance in metres and $$t$$ is the time in minutes. Which segments show Andeep has stopped?
Q5.The distance-time graph shows Andeep's journey to the shops. $$d$$ is the distance in metres from Andeep's house and $$t$$ is the time in minutes. Altogether Andeep has walked kilometres.
Q6.Izzy has drawn this distance-time graph. Which of these statements explain what is wrong with Izzy's graph.