Myths about teaching can hold you back

- Year 9
Problem solving with graphical representations
I can use my knowledge of graphical representations to solve problems.
- Year 9
Problem solving with graphical representations
I can use my knowledge of graphical representations to solve problems.
Lesson details
Key learning points
- When presented with a real-life problem, it can help to sketch what is happening.
- A sketch can provide a visual aid for understanding.
- In there is a context to the problem then the solution should be given in context.
Keywords
Linear - The relationship between two variables is linear if, when plotted on a pair of axes, a straight line is formed.
Gradient - The gradient is a measure of how steep a line is.
Intercept - An intercept is the coordinate where a line or curve meets a given axis.
Parabola - A parabola is a curve where any point on the curve is an equal distance from a fixed point (the focus) and a fixed straight line (the directrix).
Common misconception
A distance time graph will always be constructed with straight lines.
A straight line represents a consistent rate of a change, a consistent speed. In reality we need to model acceleration and deceleration which will involve curved lines.
To help you plan your year 9 maths lesson on: Problem solving with graphical representations, download all teaching resources for free and adapt to suit your pupils' needs...
To help you plan your year 9 maths lesson on: Problem solving with graphical representations, download all teaching resources for free and adapt to suit your pupils' needs.
The starter quiz will activate and check your pupils' prior knowledge, with versions available both with and without answers in PDF format.
We use learning cycles to break down learning into key concepts or ideas linked to the learning outcome. Each learning cycle features explanations with checks for understanding and practice tasks with feedback. All of this is found in our slide decks, ready for you to download and edit. The practice tasks are also available as printable worksheets and some lessons have additional materials with extra material you might need for teaching the lesson.
The assessment exit quiz will test your pupils' understanding of the key learning points.
Our video is a tool for planning, showing how other teachers might teach the lesson, offering helpful tips, modelled explanations and inspiration for your own delivery in the classroom. Plus, you can set it as homework or revision for pupils and keep their learning on track by sharing an online pupil version of this lesson.
Explore more key stage 3 maths lessons from the Graphical representations unit, dive into the full secondary maths curriculum, or learn more about lesson planning.

Licence
Lesson video
Loading...
Prior knowledge starter quiz
6 Questions
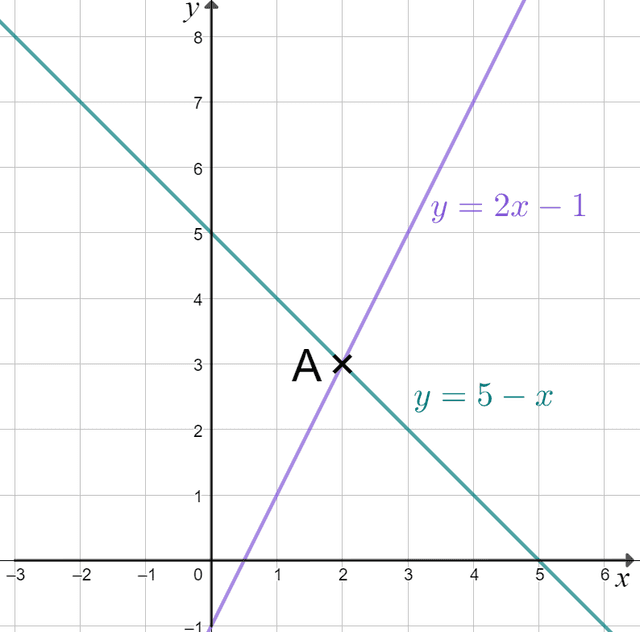
Q1.The diagram shows the lines $$y=2x-1$$ and $$y=5-x$$. The point A will help you find the solution to the __________ equations $$y=2x-1$$ and $$y=5-x$$.
Q2.Sam plots the graphs of $$y=3x+1$$ and $$y=3x-4$$ on the same coordinate grid. How many points will lie on both lines?
Q3.The linear equations $$y = 2x -9$$ and $$y = 3 − x$$ intersect at the point with coordinates (4, -1). What is the solution to the equation $$2x-9=3-x$$?
Q4.Use the graph to solve the simultaneous equations $$y=2x-1$$ and $$y=5-x$$.
Q5.The diagram shows 6 points and the the lines $$y=2x-1$$ and $$y=5-x$$. Which points satisfy the inequality $$y<5-x$$ ?
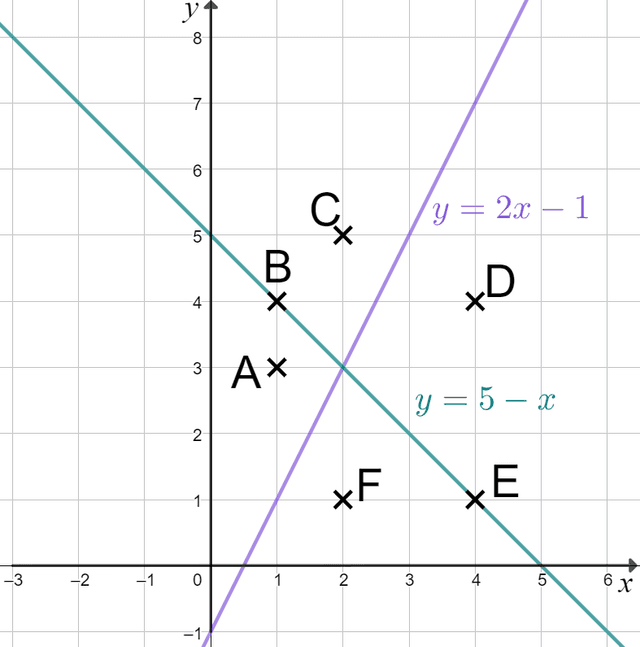
Q6.The diagram shows 6 points and the the lines $$y=2x-1$$ and $$y=5-x$$. The point that is the region $$y>5-x$$ and $$y>2x-1$$ is .
Assessment exit quiz
6 Questions
Q1.The y- is the point where a line or curve meets the $$y$$-axis.
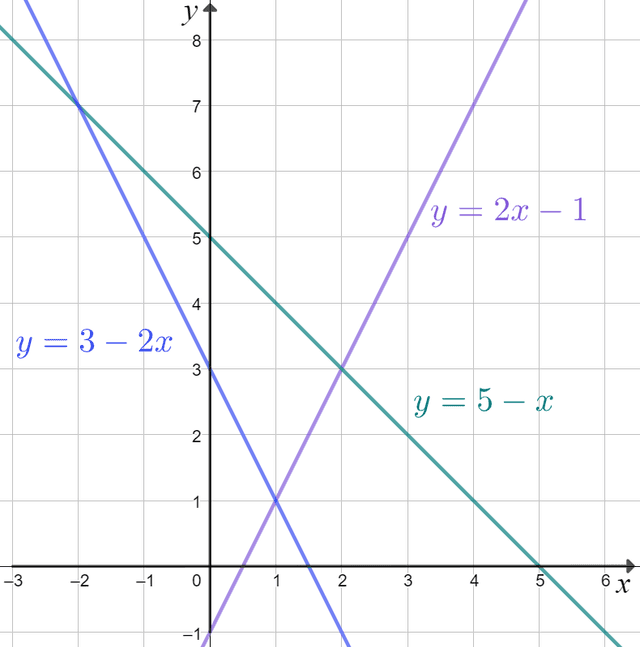
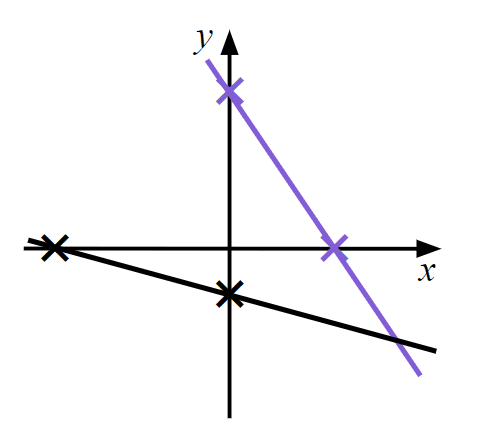
Q2.Four pupils are solving a pair of simultaneous equations. The diagram shows the graphs of the equations they are solving. Which pupils are definitely incorrect?
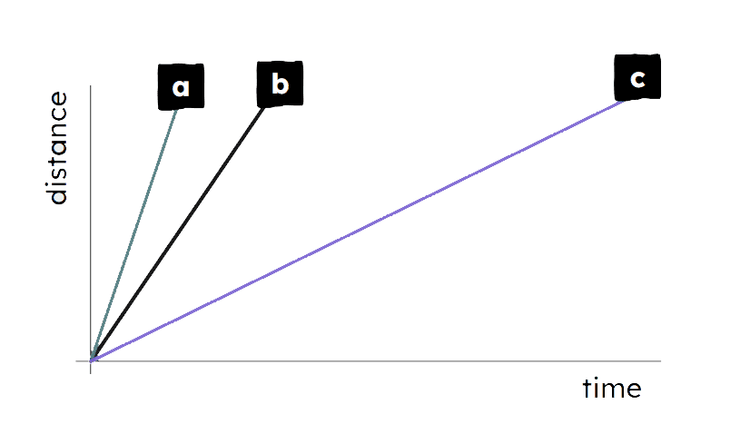
Q3.The graph models the time taken for three people to run 100 metres. Which line represents the fastest runner?
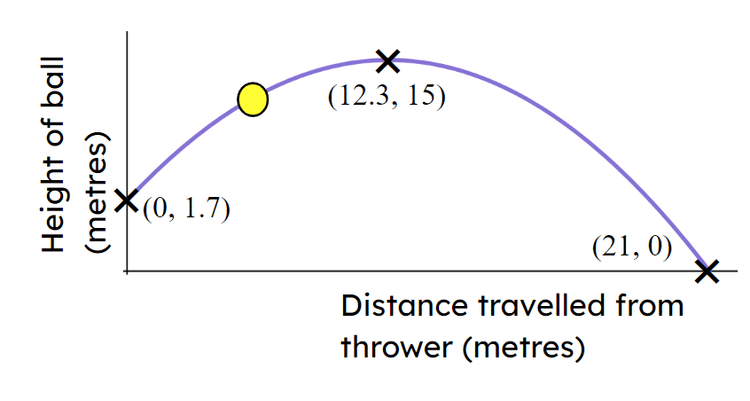
Q4.The parabola is used to model the throw of a tennis ball. The ball reaches a height of 10 metres times.
Q5.The graphs models Laura running a 100 metre race. The graph covers a distance of 110 metres. Match each section of the graph to the correct statement.
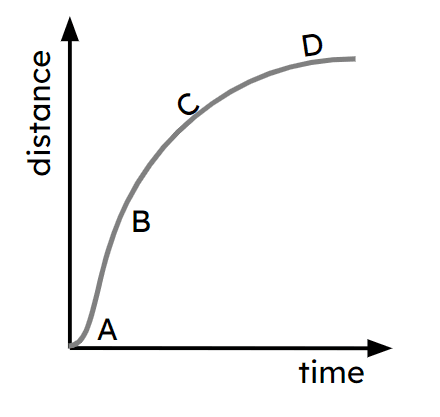
A -
Laura is accelerating
B -
Laura is running fast
C -
Laura is slowing down
D -
Laura has nearly stopped
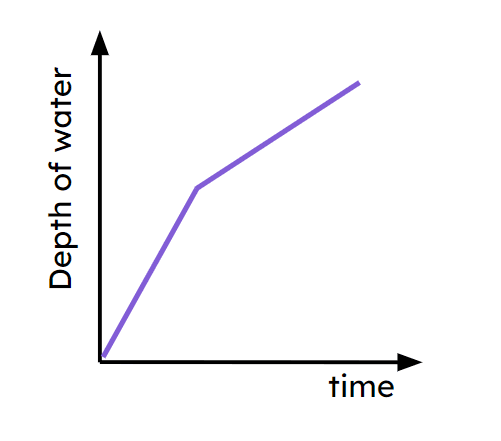
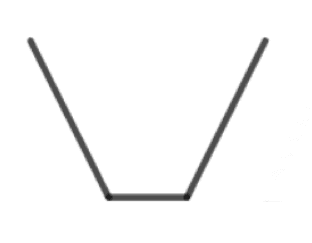
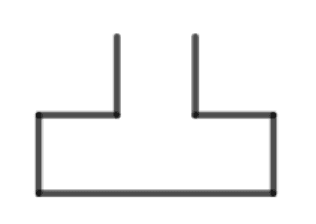
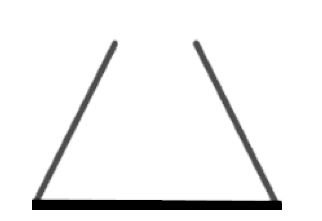
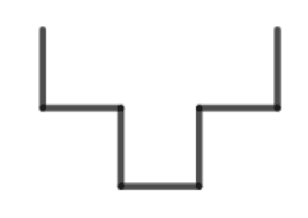
Q6.A container is filled with water at a constant rate. The graph shows the depth of water in a container as it is filled. Which of these could be a cross section of the container?