Myths about teaching can hold you back

- Year 8
Calculating the median
I can calculate the median from data presented in a frequency table and different graphs.
- Year 8
Calculating the median
I can calculate the median from data presented in a frequency table and different graphs.
Lesson details
Key learning points
- The median can be calculated from a line graph.
- The median can be calculated from an ungrouped frequency table.
- The median can be calculated from a bar chart.
Keywords
Data - Data are a collection of information
Common misconception
Pupils may choose the middle bar on the bar chart or the middle value on the x-axis as their median.
Pull off the data from the bar chart or line graph to show where the median value is.
To help you plan your year 8 maths lesson on: Calculating the median, download all teaching resources for free and adapt to suit your pupils' needs...
To help you plan your year 8 maths lesson on: Calculating the median, download all teaching resources for free and adapt to suit your pupils' needs.
The starter quiz will activate and check your pupils' prior knowledge, with versions available both with and without answers in PDF format.
We use learning cycles to break down learning into key concepts or ideas linked to the learning outcome. Each learning cycle features explanations with checks for understanding and practice tasks with feedback. All of this is found in our slide decks, ready for you to download and edit. The practice tasks are also available as printable worksheets and some lessons have additional materials with extra material you might need for teaching the lesson.
The assessment exit quiz will test your pupils' understanding of the key learning points.
Our video is a tool for planning, showing how other teachers might teach the lesson, offering helpful tips, modelled explanations and inspiration for your own delivery in the classroom. Plus, you can set it as homework or revision for pupils and keep their learning on track by sharing an online pupil version of this lesson.
Explore more key stage 3 maths lessons from the Numerical summaries of data unit, dive into the full secondary maths curriculum, or learn more about lesson planning.

Licence
Lesson video
Loading...
Prior knowledge starter quiz
6 Questions
Q1.A vet records how many of each type of pet she sees in a week. Which category of pet did the fewest people have?

Q2.How many pieces of data are represented by this bar chart?
Q3.The median is the central (middle) piece of data when the data are in numerical . It is a measure of central tendency representing the average of the values.
Q4.The median of these data: 1, 1, 1, 3, 5, 5, 5, 6, 6, 7, 7, 8, 8, 9 is .
Q5.The median of these data: 8.0, 2.2, 4.5, 8.9, 3.1, 3.4, 4.6, 8.2, 5.7 is .
Q6.A large data set has 455 values. The median is the th data value when the data is in order of size.
Assessment exit quiz
6 Questions
Q1.A measure of central tendency is a summary measure that attempts to describe a whole set of data with a value that represents the middle or centre of its distribution.
Q2.An ordered data has 4751 pieces of data. The median is in the th position.
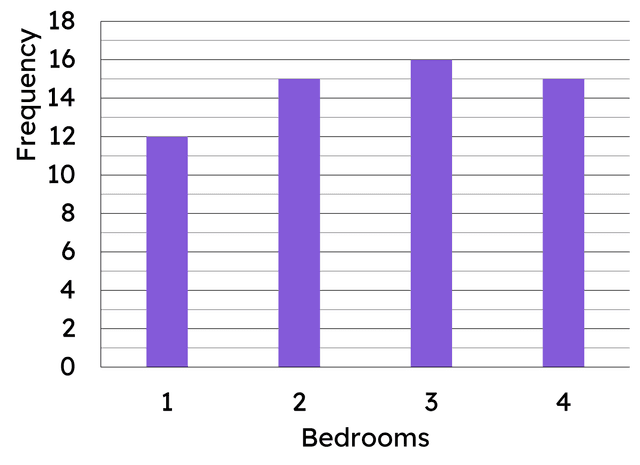
Q3.An estate agent records how many bedrooms each house has on their sales list. The number of houses with 2 bedrooms or fewer is .

Q4.A football coach records the number of goals scored in the last 45 matches. What is the median number of goals scored?

Q5.The median will __________ be in the middle bar on a bar chart.
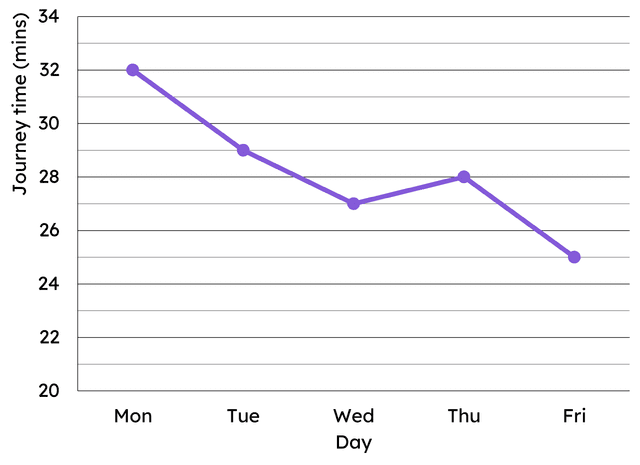
Q6.Jun records how long it takes him to get to school each day for a week. Jun's results are shown on the line graph. Jun's median journey time is minutes.