Myths about teaching can hold you back

- Year 8
Calculating the mode
I can calculate the mode from data presented in a frequency table and different graphs.
- Year 8
Calculating the mode
I can calculate the mode from data presented in a frequency table and different graphs.
Lesson details
Key learning points
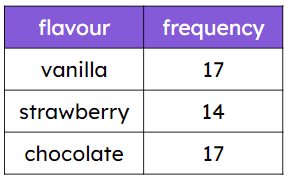
- The mode can be calculated from an ungrouped frequency table.
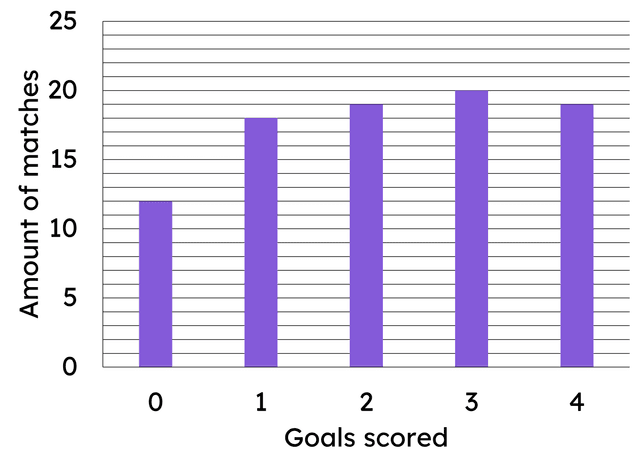
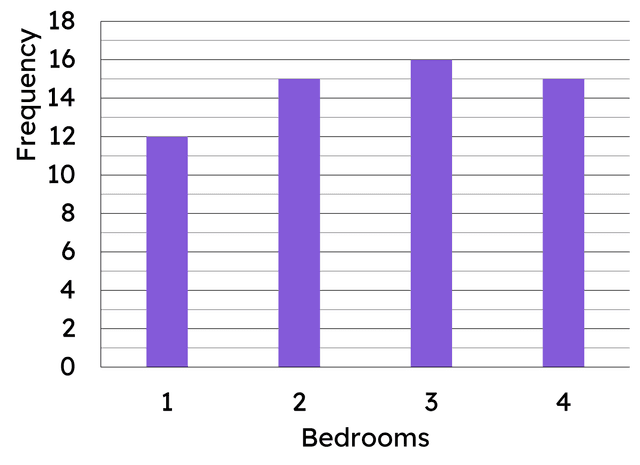
- The mode can be calculated from a bar chart.
- The mode can be calculated from a line graph.
Keywords
Frequency - The frequency is the number of times an event occurs; or the number of individuals (people, animals etc.) with some specific property.
Mode - The mode is the most frequent value. It is a measure of central tendency representing the average of the values.
Common misconception
Pupils may mistakenly choose the bars which have the same heights to be the mode.
By reminding the pupils of the definition of the mode and asking the question in the context of the data, this should support students.
To help you plan your year 8 maths lesson on: Calculating the mode, download all teaching resources for free and adapt to suit your pupils' needs...
To help you plan your year 8 maths lesson on: Calculating the mode, download all teaching resources for free and adapt to suit your pupils' needs.
The starter quiz will activate and check your pupils' prior knowledge, with versions available both with and without answers in PDF format.
We use learning cycles to break down learning into key concepts or ideas linked to the learning outcome. Each learning cycle features explanations with checks for understanding and practice tasks with feedback. All of this is found in our slide decks, ready for you to download and edit. The practice tasks are also available as printable worksheets and some lessons have additional materials with extra material you might need for teaching the lesson.
The assessment exit quiz will test your pupils' understanding of the key learning points.
Our video is a tool for planning, showing how other teachers might teach the lesson, offering helpful tips, modelled explanations and inspiration for your own delivery in the classroom. Plus, you can set it as homework or revision for pupils and keep their learning on track by sharing an online pupil version of this lesson.
Explore more key stage 3 maths lessons from the Numerical summaries of data unit, dive into the full secondary maths curriculum, or learn more about lesson planning.

Licence
Lesson video
Loading...
Prior knowledge starter quiz
6 Questions
Q1.Sets of data which have modes are known as bimodal data.
Q2.Select the frequency table that shows the data represented in this bar chart.
Q3.Select the data set that matches the line graph.
Q4.This list of data: 4, 6, 3, 6, 2, 8, 2, 9, 2 6, 3, 6, 5 has a mode of .
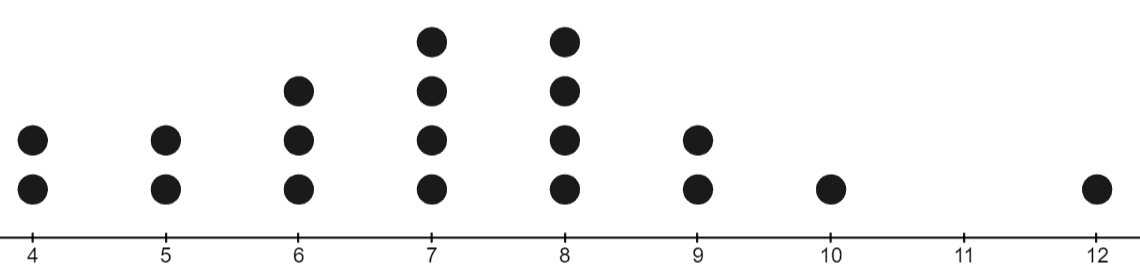
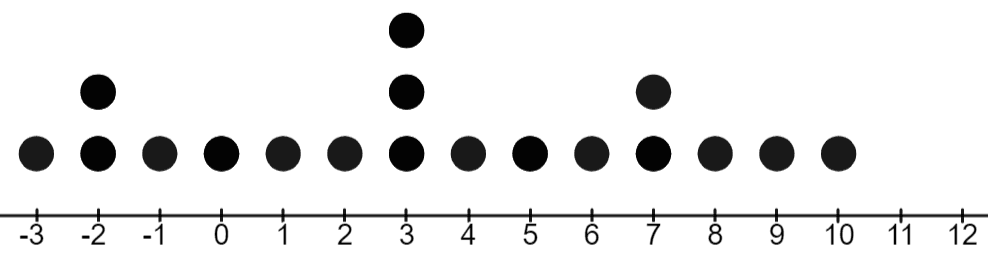
Q5.The data represented on this dot plot has __________ mode(s).
Q6.Which of these are trimodal data sets?
Assessment exit quiz
6 Questions
Q1.The is the most frequent value. It is a measure of central tendency representing the average of the values.
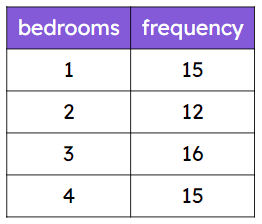
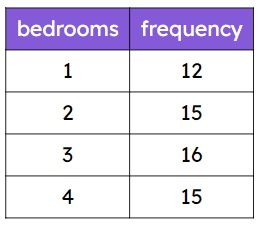
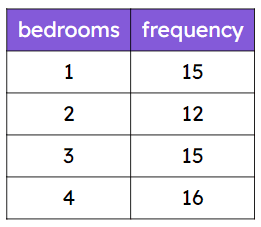
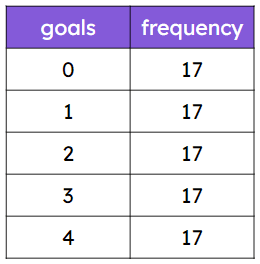
Q2.Which of these frequency tables has no mode?


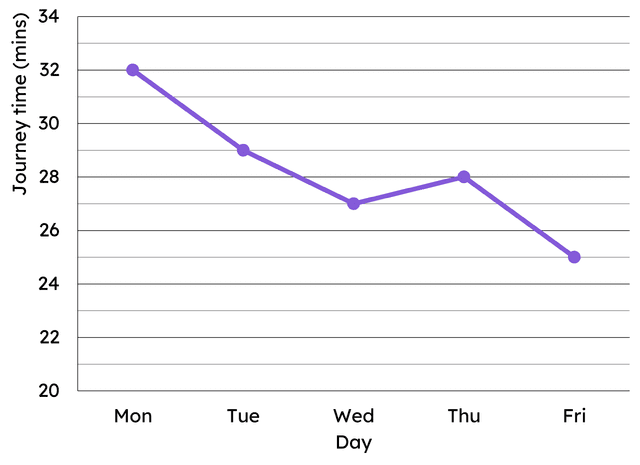
Q3.This line graph shows data about the time taken for the journey to school in one week. Which of the following statements is correct?
Q4.The modal pet type is .
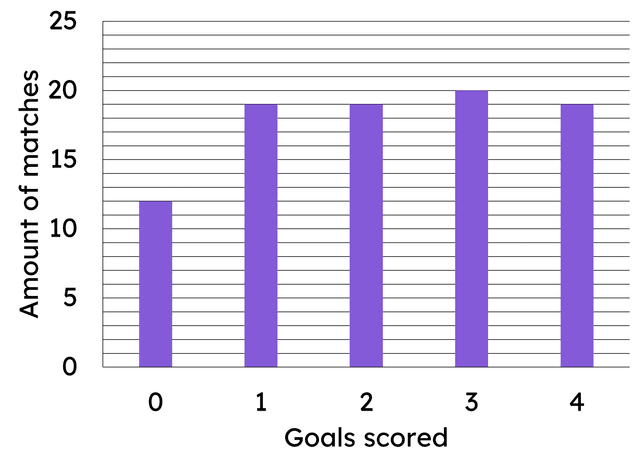
Q5.This bar chart shows data about the goals scored in matches over a season. The modal number of goals scored in a match is goals.
Q6.Select all the data sets that show bimodal data.