Myths about teaching can hold you back

- Year 8
Changing a data point
I can see how certain statistical measures may change as a result of changes in the data.
- Year 8
Changing a data point
I can see how certain statistical measures may change as a result of changes in the data.
Lesson details
Key learning points
- Changing the value of one data point can affect the mode.
- Changing the value of one data point can affect the median.
- Changing the value of one data point can affect the mean.
Keywords
Bimodal - Sets of data which have two modes are known as bimodal data.
Mean - The (arithmetic) mean for a set of numerical data is the sum of the values divided by the number of values.
Median - The median is the central (middle) piece of data when a set of numerical data is in numerical order.
Mode - The mode is the most frequent value in a dataset.
Common misconception
Averages (mean, median, mode) will always change if a data point needs to be added, removed, edited.
The mean, median, or mode will remain invariant if a data point is added with the same value as that average.
To help you plan your year 8 maths lesson on: Changing a data point, download all teaching resources for free and adapt to suit your pupils' needs...
To help you plan your year 8 maths lesson on: Changing a data point, download all teaching resources for free and adapt to suit your pupils' needs.
The starter quiz will activate and check your pupils' prior knowledge, with versions available both with and without answers in PDF format.
We use learning cycles to break down learning into key concepts or ideas linked to the learning outcome. Each learning cycle features explanations with checks for understanding and practice tasks with feedback. All of this is found in our slide decks, ready for you to download and edit. The practice tasks are also available as printable worksheets and some lessons have additional materials with extra material you might need for teaching the lesson.
The assessment exit quiz will test your pupils' understanding of the key learning points.
Our video is a tool for planning, showing how other teachers might teach the lesson, offering helpful tips, modelled explanations and inspiration for your own delivery in the classroom. Plus, you can set it as homework or revision for pupils and keep their learning on track by sharing an online pupil version of this lesson.
Explore more key stage 3 maths lessons from the Numerical summaries of data unit, dive into the full secondary maths curriculum, or learn more about lesson planning.

Licence
Lesson video
Loading...
Prior knowledge starter quiz
6 Questions
Q1.Which of these statements defines the median?
Q2.Calculate the mean for this data set.

Q3.Match the summary statistic to its value.

3
4
-1
12
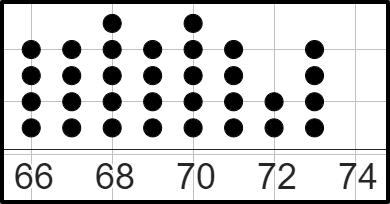
Q4.Which of these statements is true for this dot plot?
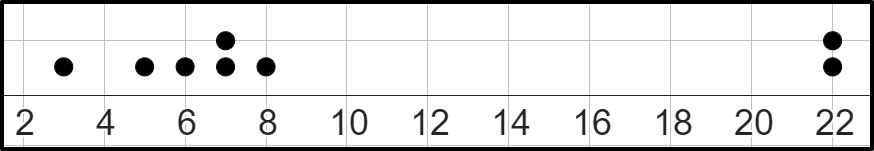
Q5.First calculate the mean for this dot plot, then select the correct statements.
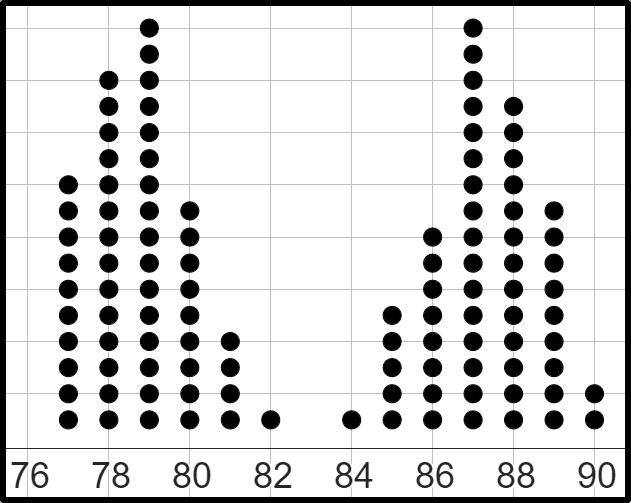
Q6.Without carrying out any calculations select which of these statements are likely to be true for this dot plot.
Assessment exit quiz
6 Questions
Q1.One data point on this dot plot was incorrectly typed in. After the data point is modified and corrected, Andeep notices the mode has changed. Which of these statements must be true?
Q2.The mean of this dot plot is currently 15.75. A new data point is collected and added to the data set. Laura re-calculates the mean and notices it has decreased. What could the new data point be?
Q3.The mean of this dot plot is 15.75. A data point is no longer relevant and removed from the data set. Sam re-calculates the mean and notices it has decreased. What could the new data point be?
Q4.A data point is removed from this dataset, as it is no longer relevant to an investigation. Which of the following are possible outcomes after the data point is removed?

Q5.Match each possible change to the data set to the correct description of its impact on the median.

The median becomes 4.
The median becomes 9.
The median stays the same.
The median becomes 8.
Q6.Match each possible change to the data set to the correct description of its impact on the mean.
The mean increases by 2.
The mean decreases by 1.
The mean increases to 8.
The mean stays the same.
The mean decreases to 4.