Comparing summaries of data

Lesson details
Learning outcome
I can use the different measures of central tendency and spread to compare two sets of data.
Key learning points
- Statistical summaries of data can be used to make inferences about that data.
- Two sets of statistical summaries can be used to compare the respective data sets.
- Statistical summaries have their limitations.
Keywords
Central tendency - is a summary measure that attempts to describe a whole dataset with a single value that represents the middle or centre of its distribution.
Spread - The spread/dispersion of data values describes how far apart the pieces of data are.
Dispersion - The spread/dispersion of data values describes how far apart the pieces of data are.
Common misconception
If two datasets have the same mean, then the distribution of data points will look similar.
Even with the same mean, two datasets could have vastly different ranges. One dataset could be bimodal, whilst the other could be unimodal.
Teacher tip
Caution on the multi-use of the term "average". It is used: as an umbrella term for the mean, median, and mode; as well as to describe one average (most commonly the mean average); and as a general term to informally describe central tendency.
Licence
Lesson video
Loading...
Prior knowledge starter quiz
6 Questions
Q1.Which of these is not a measure of central tendency?
Q2.Describe the modal properties of this data set: 12, 12, 9, 8, 8, 4, 0, 3, 12, 9, 9
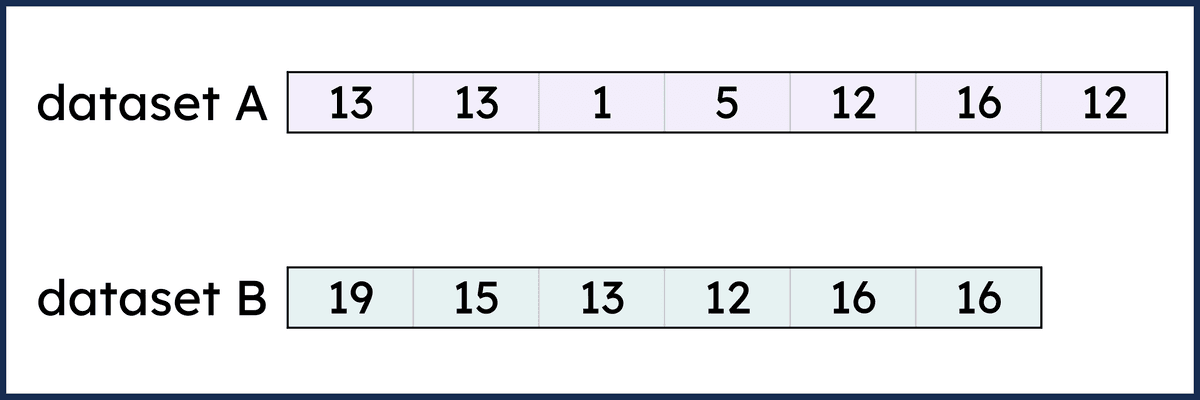
Q3.By how much is the range of data set A greater than the range of data set B?
Q4.Match each of the mean, median, mode, and range to its value for this data set: 1, 1, 1, 3, 3, 5, 6, 7, 9
4
3
1
8
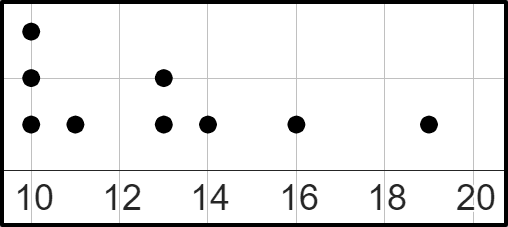
Q5.Match each summary statistic to its value for this dot plot.
9
10
13
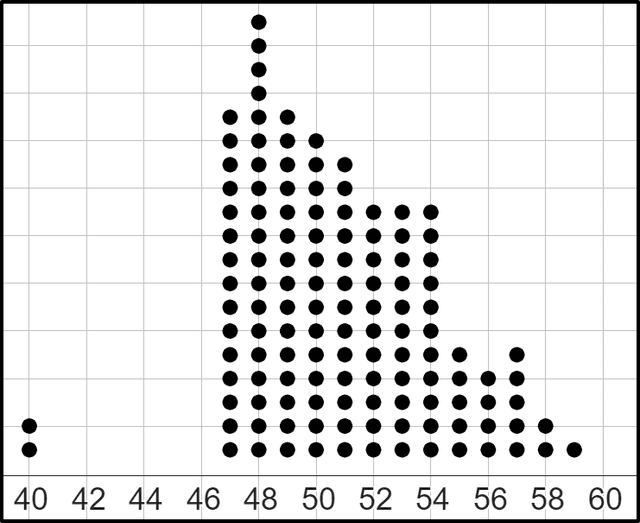
Q6.Which of these is a reasonable estimate for the mean of this data set?
Assessment exit quiz
6 Questions
Q1.Match the summary statistic to the word that can be used to help in its interpretation.
typical value
middle value
most frequent value
how varied the data set is
Q2.Which of these is a valid interpretation of the mean number of points Lucas and Sofia have scored when playing the new video game?
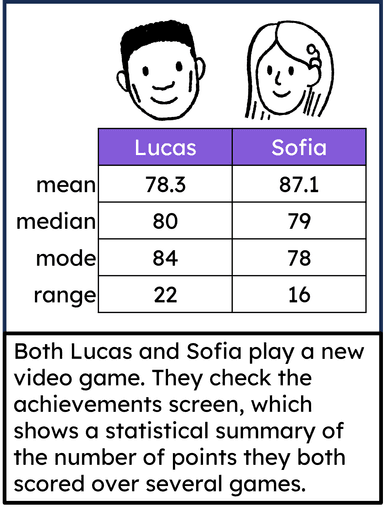
Q3.Which of these is a valid interpretation of the range of points Lucas and Sofia scored when playing the new video game?
Q4.Which of these statements are true for the median and modal number of goals Jun and Aisha scored over 11 netball matches?
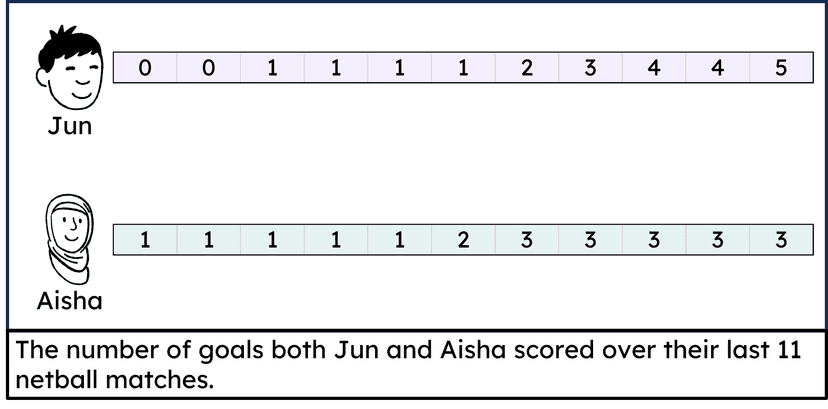
Q5.Which of these statements are an accurate interpretation of the number of goals Jun and Aisha scored over 11 netball matches?
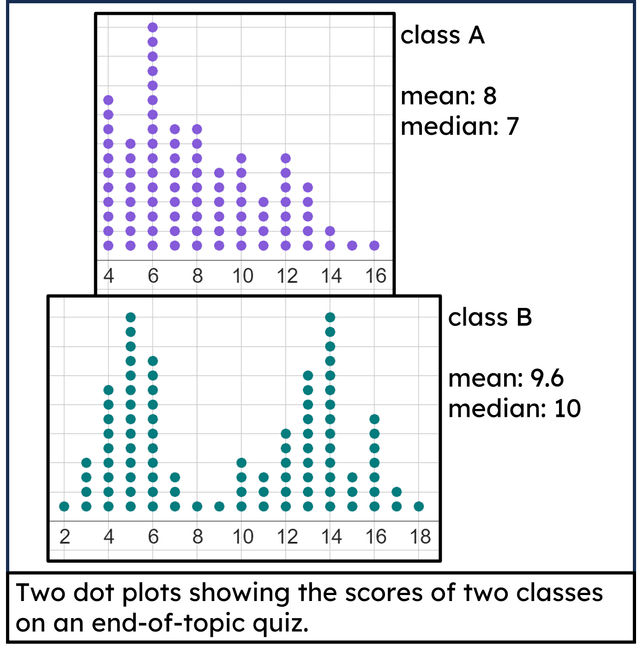
Q6.Which of these statements combine to make an accurate comparison of which class performed better on an end-of-topic quiz.
To help you plan your 8 maths lesson on: Comparing summaries of data, download all teaching resources for free and adapt to suit your pupils' needs...
To help you plan your 8 maths lesson on: Comparing summaries of data, download all teaching resources for free and adapt to suit your pupils' needs.
The starter quiz will activate and check your pupils' prior knowledge, with versions available both with and without answers in PDF format.
We use learning cycles to break down learning into key concepts or ideas linked to the learning outcome. Each learning cycle features explanations with checks for understanding and practice tasks with feedback. All of this is found in our slide decks, ready for you to download and edit. The practice tasks are also available as printable worksheets and some lessons have additional materials with extra material you might need for teaching the lesson.
The assessment exit quiz will test your pupils' understanding of the key learning points.
Our video is a tool for planning, showing how other teachers might teach the lesson, offering helpful tips, modelled explanations and inspiration for your own delivery in the classroom. Plus, you can set it as homework or revision for pupils and keep their learning on track by sharing an online pupil version of this lesson.
Explore more key stage 3 maths lessons from the Numerical summaries of data unit, dive into the full secondary maths curriculum, or learn more about lesson planning.