Myths about teaching can hold you back

- Year 8
Problem solving with numerical summaries of data
I can use my understanding of various data summaries to solve problems.
- Year 8
Problem solving with numerical summaries of data
I can use my understanding of various data summaries to solve problems.
Lesson details
Key learning points
- Stated conclusions should be critically evaluated to ensure validity.
- Certain statistical summaries may be omitted in the real world.
- In order to make more accurate conclusions, you need the data set and the conditions it was collected in.
Keywords
Statistical summary - A statistical summary sums up the features of a data set.
Central tendency - A summary measure that attempts to describe a whole set of data with a single value that represents the middle or centre of its distribution
Range - The range is a measure of spread. It is found by finding the difference between the highest and lowest values
Common misconception
Reporting two averages when asked to make two comparisons between sets of data.
Mean, media and mode essentially measure the same thing: central tendency. So use one of the comparisons to comment on the spread of data.
To help you plan your year 8 maths lesson on: Problem solving with numerical summaries of data, download all teaching resources for free and adapt to suit your pupils' needs...
To help you plan your year 8 maths lesson on: Problem solving with numerical summaries of data, download all teaching resources for free and adapt to suit your pupils' needs.
The starter quiz will activate and check your pupils' prior knowledge, with versions available both with and without answers in PDF format.
We use learning cycles to break down learning into key concepts or ideas linked to the learning outcome. Each learning cycle features explanations with checks for understanding and practice tasks with feedback. All of this is found in our slide decks, ready for you to download and edit. The practice tasks are also available as printable worksheets and some lessons have additional materials with extra material you might need for teaching the lesson.
The assessment exit quiz will test your pupils' understanding of the key learning points.
Our video is a tool for planning, showing how other teachers might teach the lesson, offering helpful tips, modelled explanations and inspiration for your own delivery in the classroom. Plus, you can set it as homework or revision for pupils and keep their learning on track by sharing an online pupil version of this lesson.
Explore more key stage 3 maths lessons from the Numerical summaries of data unit, dive into the full secondary maths curriculum, or learn more about lesson planning.

Licence
Lesson video
Loading...
Prior knowledge starter quiz
6 Questions
Q1.The dot plot represents a set of data. The mode for this data is .
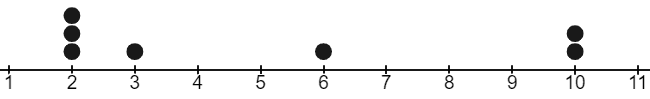
Q2.The dot plot represents a set of data. The median for this data is .
Q3.The dot plot represents a set of data. The mean for this data is
Q4.The dot plot represents a set of data. The range for this data is
Q5.Select all of the measures that are types of averages.
Q6.Two classes of pupils sit a test. The range of scores in Class A is 22; the range in scores for Class B is 35. Which conclusion is valid for this statistical summary?
Assessment exit quiz
6 Questions
Q1.The central tendency of a dataset can be described by using an , such as the mean, median or mode.
Q2.The spread of a dataset can be described by using the .
Q3.The table shows summary statistics about how many points each person scored during a series of hockey games. The mode suggests that tended to score the highest each game.
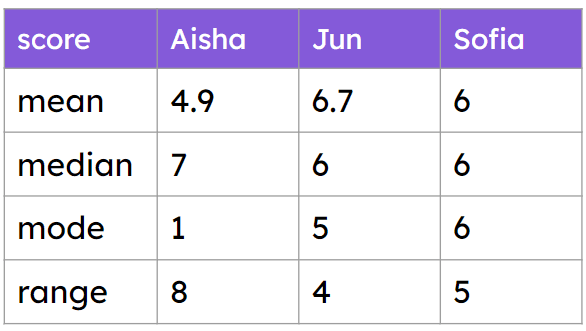
Q4.The table shows summary statistics about how many points each person scored during a series of hockey games. Which measure suggests that Jun tended to score the highest in each game?
Q5.The table shows summary statistics about how many points each person scored during a series of hockey games. Which measure suggests that Aisha tends to score the highest in each game?
Q6.The table shows summary statistics about how many points each person scored during a series of hockey games. Whose scores tend to be the most consistent?