Myths about teaching can hold you back

- Year 8
Statistical problems - data collection
I can choose what data needs to be collected to explore a statistical problem.
- Year 8
Statistical problems - data collection
I can choose what data needs to be collected to explore a statistical problem.
Lesson details
Key learning points
- Different statistical problems need investigating in different ways.
- Effective data collection avoids bias where appropriate.
- When sampling from a population, the sample size needs to be practical.
Keywords
Population - The population is the entire set of people, creatures, plants or items that make up the whole group which is being studied.
Bias - Bias can be present in any sample collected from a population and may affect the results of a statistical investigation
Sample - A sample is a subset of the population
Common misconception
The word 'population' always refers to the entire population of a country or the world.
The population in a given context is defined by the entire set of people/creatures/items that are being considered.
To help you plan your year 8 maths lesson on: Statistical problems - data collection, download all teaching resources for free and adapt to suit your pupils' needs...
To help you plan your year 8 maths lesson on: Statistical problems - data collection, download all teaching resources for free and adapt to suit your pupils' needs.
The starter quiz will activate and check your pupils' prior knowledge, with versions available both with and without answers in PDF format.
We use learning cycles to break down learning into key concepts or ideas linked to the learning outcome. Each learning cycle features explanations with checks for understanding and practice tasks with feedback. All of this is found in our slide decks, ready for you to download and edit. The practice tasks are also available as printable worksheets and some lessons have additional materials with extra material you might need for teaching the lesson.
The assessment exit quiz will test your pupils' understanding of the key learning points.
Our video is a tool for planning, showing how other teachers might teach the lesson, offering helpful tips, modelled explanations and inspiration for your own delivery in the classroom. Plus, you can set it as homework or revision for pupils and keep their learning on track by sharing an online pupil version of this lesson.
Explore more key stage 3 maths lessons from the Numerical summaries of data unit, dive into the full secondary maths curriculum, or learn more about lesson planning.

Licence
Lesson video
Loading...
Prior knowledge starter quiz
6 Questions
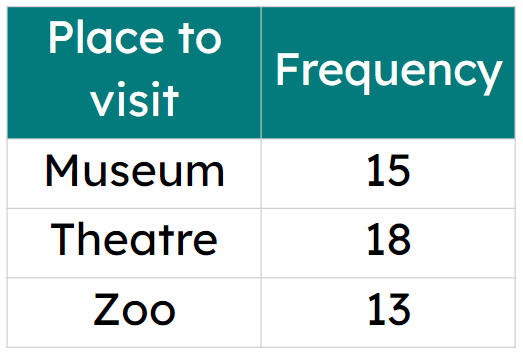
Q1.When you count how many individuals (people, animals etc.) are in each category of a data set you are finding the for each category.
Q2.Put the stages of a data investigation in order.
Q3.Which of these data sets can only contain integer values?
Q4.Which tool measures length?
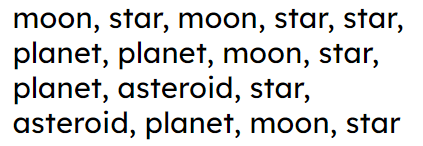
Q5.What is the frequency of 'moon' in the list?
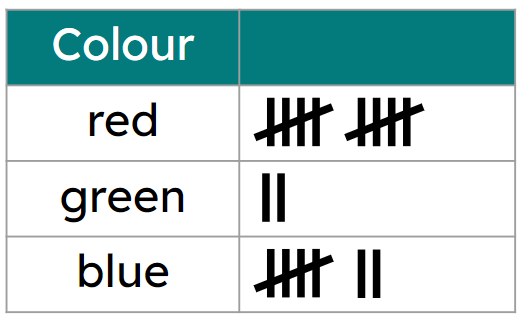
Q6.Which is an example of a tally chart?