Myths about teaching can hold you back

- Year 8
Summarising data
I can see that the different measures of central tendency offer a summary of a set of data.
- Year 8
Summarising data
I can see that the different measures of central tendency offer a summary of a set of data.
Lesson details
Key learning points
- The mode is a useful measure of central tendency for certain data sets.
- The median is a useful measure of central tendency for certain data sets.
- The mean is a useful measure of central tendency for certain data sets.
Keywords
Data - Data are a collection of information.
Mean - The (arithmetic) mean for a set of numerical data is the sum of the values divided by the number of values.
Median - The median is the central (middle) piece of data when the data are in numerical order.
Mode - Mode is the most frequent value. It is a measure of central tendency representing the average of the values.
Measure of central tendency - A summary that attempts to describe a whole set of data with a single value that represents the middle of the distribution.
Common misconception
The mean is the most meaningful average.
Looking at bimodal data, trimodal data or data with extreme outliers. Context may be relevant.
To help you plan your year 8 maths lesson on: Summarising data, download all teaching resources for free and adapt to suit your pupils' needs...
To help you plan your year 8 maths lesson on: Summarising data, download all teaching resources for free and adapt to suit your pupils' needs.
The starter quiz will activate and check your pupils' prior knowledge, with versions available both with and without answers in PDF format.
We use learning cycles to break down learning into key concepts or ideas linked to the learning outcome. Each learning cycle features explanations with checks for understanding and practice tasks with feedback. All of this is found in our slide decks, ready for you to download and edit. The practice tasks are also available as printable worksheets and some lessons have additional materials with extra material you might need for teaching the lesson.
The assessment exit quiz will test your pupils' understanding of the key learning points.
Our video is a tool for planning, showing how other teachers might teach the lesson, offering helpful tips, modelled explanations and inspiration for your own delivery in the classroom. Plus, you can set it as homework or revision for pupils and keep their learning on track by sharing an online pupil version of this lesson.
Explore more key stage 3 maths lessons from the Numerical summaries of data unit, dive into the full secondary maths curriculum, or learn more about lesson planning.

Licence
Lesson video
Loading...
Prior knowledge starter quiz
6 Questions
Q1.Match the summary statistic to its definition.
is the sum of the values divided by the number of values
is the middle piece of data when the data are in order
is the most frequent value
is a measure of spread
Q2.Find the mode of this list of numbers: 4, 7, 16, 16, 22, 23, 24, 28
Q3.Find the median of this list of numbers. 4, 7, 16, 16, 22, 23, 24, 28
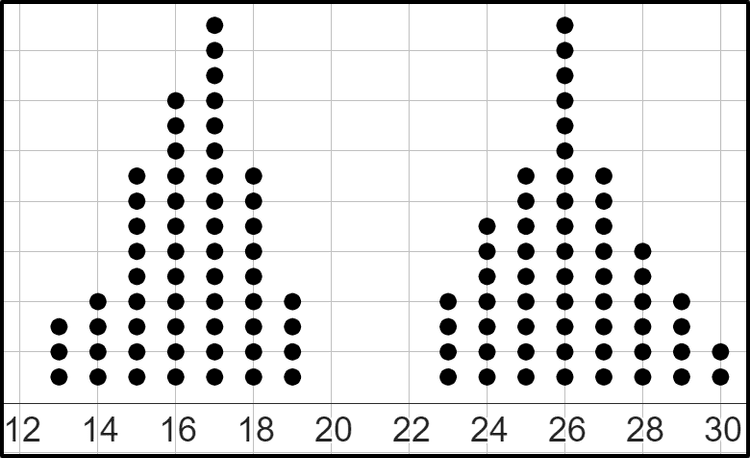
Q4.Find the modal value of this dataset from its dot plot.
Q5.Work out the mean of this dataset: (-6), (-5), (-3), (-3), 1, 4, 5, 7
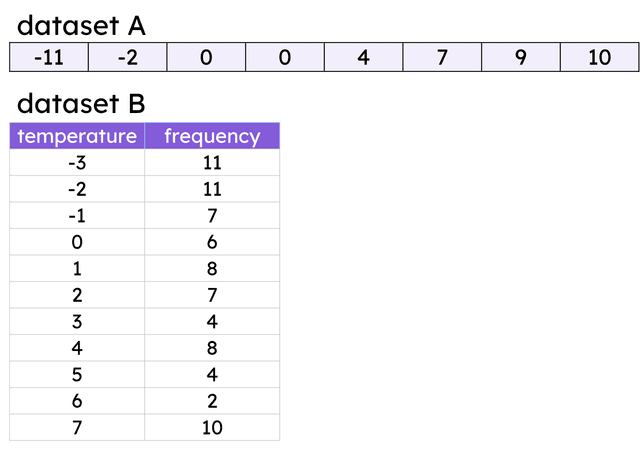
Q6.Dataset A and dataset B both show the minimum temperatures in two different locations. How much bigger is the range of dataset A than the range of dataset B?
Assessment exit quiz
6 Questions
Q1.Which of these most closely describe a "measure of central tendency"?
Q2.Describe the modal properties of this dataset: 2, 2, 6, 5, 6, 6, 3, 4, 0, 9, 2
Q3.For the following dataset, match the summary statistic to its value: 10, 14, 14, 18, 19, 21, 23
17
18
14
13
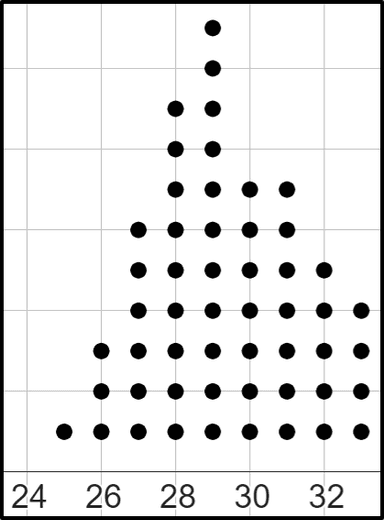
Q4.Which of these is the most likely value of the mean for this dataset, represented by a dot plot?
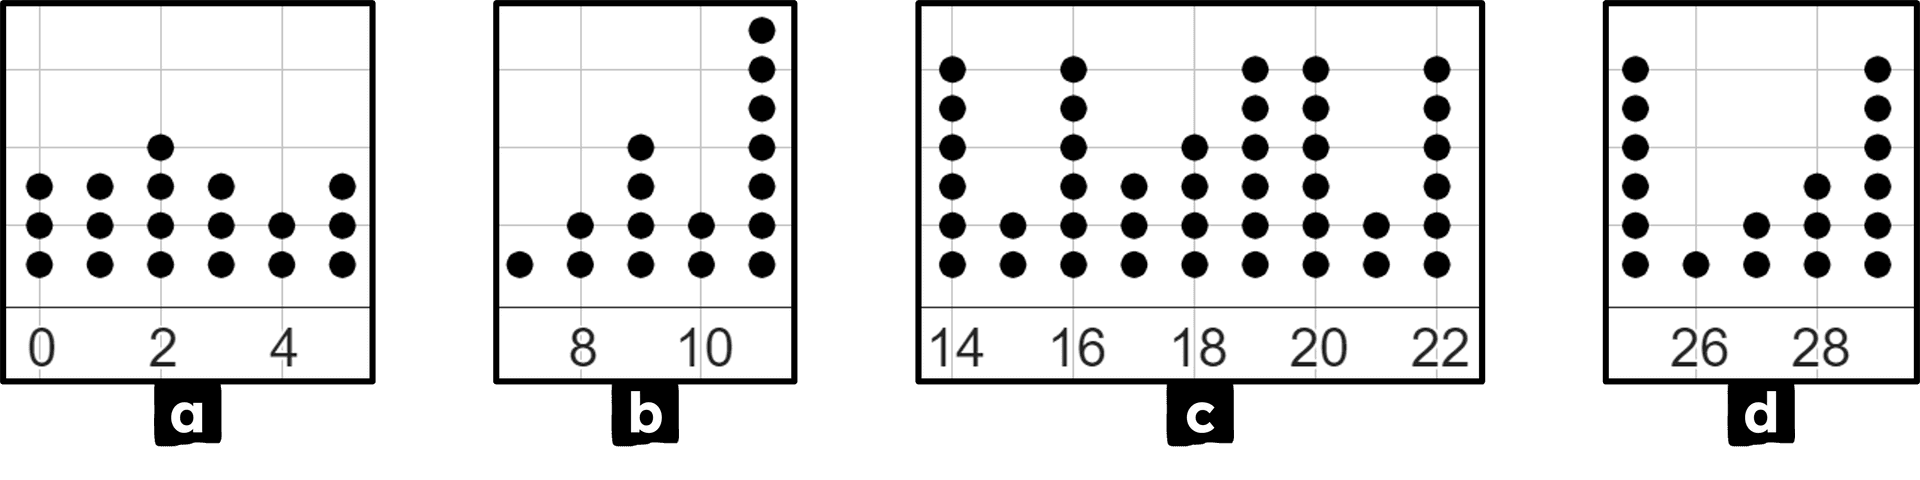
Q5.In which of these dot plots would the mode be a representative summary of the dataset?
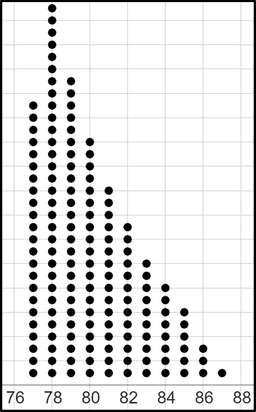
Q6.Which of the following statements are true for this dot plot when evaluating whether the median is a representative summary of the data?