New
New
Year 8

Understanding and calculating the range

I can understand what the range is measuring, how it is measuring it and calculate the range from data presented in a range of different ways.

New
New
Year 8

Understanding and calculating the range

I can understand what the range is measuring, how it is measuring it and calculate the range from data presented in a range of different ways.

Lesson details

Key learning points

  1. The range is a measure of spread.
  2. The range is difference between the highest and lowest data point.
  3. The range shows how spread out (far apart) the extreme values in the data set are.

Common misconception

Pupils may often write the range as '3 to 10' or '10 - 3' rather than a single value.

Remind pupils that the range is a single value which describes how far apart the extreme values are.

Keywords

  • Range - The range is a measure of spread. It is found by finding the difference between the highest and lowest values.

  • Spread/Dispersion - The spread/dispersion of data values describes how far apart the pieces of data are.

Pupils could be challenged to make their own data sets that have particular averages and a certain range.
Teacher tip

Licence

This content is © Oak National Academy Limited (2024), licensed on Open Government Licence version 3.0 except where otherwise stated. See Oak's terms & conditions (Collection 2).

Loading...

6 Questions

Q1.
Work out: $$ 128 - 94 $$ =
Correct Answer: 34, thirty four
Q2.
Work out: $$ (-28) - (-47) $$ =
Correct Answer: 19, nineteen
Q3.
Work out: $$ 63.8 - 19.7 $$ =
Correct Answer: 44.1
Q4.
are a collection of information.
Correct Answer: Data, data
Q5.
Two numbers have a difference of 10. The smaller number is 53. The other number is
Correct Answer: 63, sixty three, sixty-three
Q6.
Two positive numbers have a difference of 8. One of the numbers is 6. The other number is
Correct Answer: 14, fourteen

6 Questions

Q1.
The range is a measure of spread. It is found by finding the between the two extreme points; the lowest and highest values.
Correct Answer: difference
Q2.
Select the data sets where you can calculate a range.
Correct answer: 4, 7, 5, 8, 3, 1, 0
cat, dog, rabbit, dog, cat, rabbit, hamster
Correct answer: -4, -2, -5, -1, 0, -7
Correct answer: 5, 5, 5, 5, 5, 5, 5, 5, 5
ash, birch, oak, maple, sycamore, oak
Q3.
A large data set has the extreme values of 24.6 and 59.2. The range of the data set is .
Correct Answer: 34.6
Q4.
Which of these dot plots is most varied?
Correct Answer: An image in a quiz
An image in a quiz
An image in a quiz
An image in a quiz
Q5.
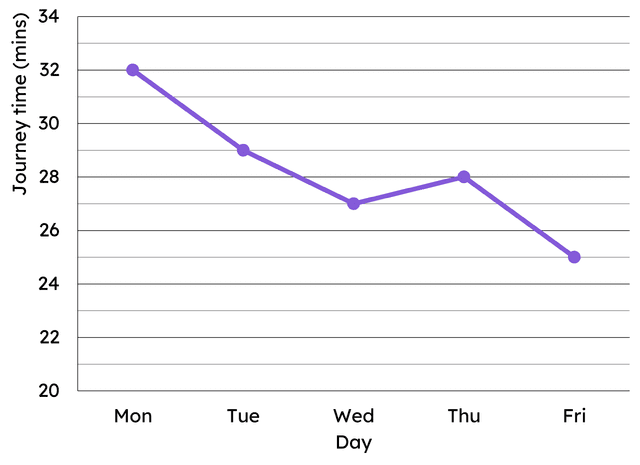
This line graph shows data about journey times to school over a week. The range of the journey times is minutes.
An image in a quiz
Correct Answer: 7, 7, seven
Q6.
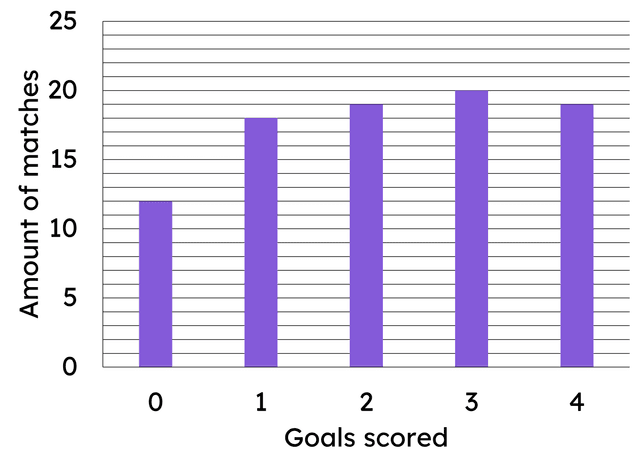
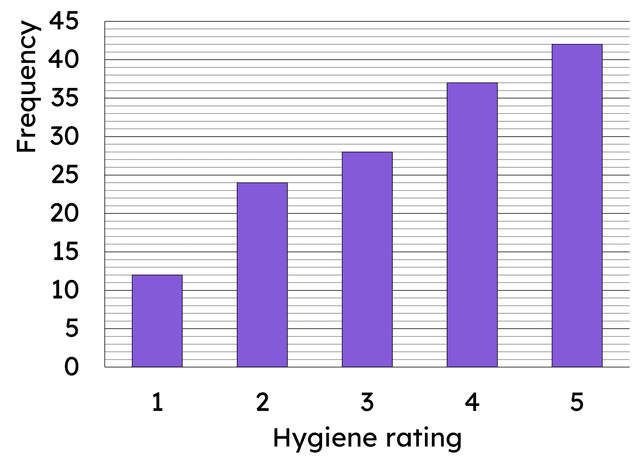
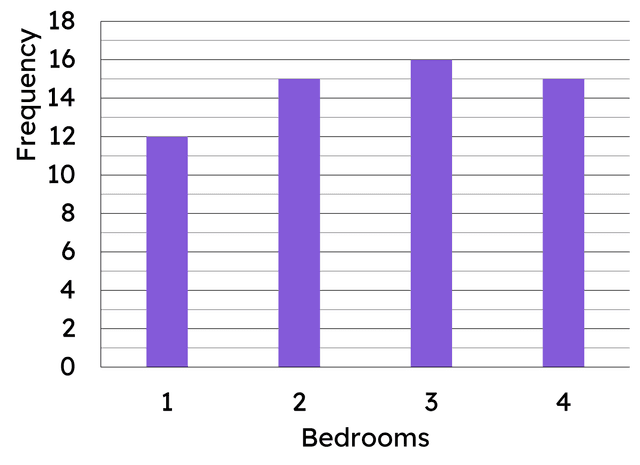
Which of these bar charts show data with a range of 4?
Correct Answer: An image in a quiz
An image in a quiz
Correct Answer: An image in a quiz
An image in a quiz
An image in a quiz