Myths about teaching can hold you back

- Year 9
Comparing representations of outcomes for more than two events
I can identify the same outcome across all the different representations.
- Year 9
Comparing representations of outcomes for more than two events
I can identify the same outcome across all the different representations.
Lesson details
Key learning points
- Fluency in moving between the representations is important.
- Sometimes it is better to display the outcomes using a particular representation.
Keywords
Outcome table - An outcome table is a table that shows all the possible outcomes.
Tree diagram - Tree diagrams are a representation used to model statistical/probability questions. Branches represent different possible events or outcomes.
Outcome tree - Each branch of an outcome tree shows a possible outcome from an event or from a stage of a trial. The full outcome tree shows all possible outcomes.
Venn diagram - Venn diagrams are a representation used to model statistical/probability questions. Commonly circles are used to represent events.
Common misconception
I can use outcome tables to categorise outcomes into as many events as I want.
Outcome tables are limited to categorising outcomes into only two events. You can use more tables to categorise outcomes into three or more events, but the number of tables you need quickly becomes massive!
To help you plan your year 9 maths lesson on: Comparing representations of outcomes for more than two events, download all teaching resources for free and adapt to suit your pupils' needs...
To help you plan your year 9 maths lesson on: Comparing representations of outcomes for more than two events, download all teaching resources for free and adapt to suit your pupils' needs.
The starter quiz will activate and check your pupils' prior knowledge, with versions available both with and without answers in PDF format.
We use learning cycles to break down learning into key concepts or ideas linked to the learning outcome. Each learning cycle features explanations with checks for understanding and practice tasks with feedback. All of this is found in our slide decks, ready for you to download and edit. The practice tasks are also available as printable worksheets and some lessons have additional materials with extra material you might need for teaching the lesson.
The assessment exit quiz will test your pupils' understanding of the key learning points.
Our video is a tool for planning, showing how other teachers might teach the lesson, offering helpful tips, modelled explanations and inspiration for your own delivery in the classroom. Plus, you can set it as homework or revision for pupils and keep their learning on track by sharing an online pupil version of this lesson.
Explore more key stage 3 maths lessons from the Probability: possible outcomes unit, dive into the full secondary maths curriculum, or learn more about lesson planning.

Licence
Lesson video
Loading...
Prior knowledge starter quiz
6 Questions
Q1.The Venn diagram shows the sample space $$\xi$$ = {2, 7, 77, 104}. Match each region to the correct outcome.
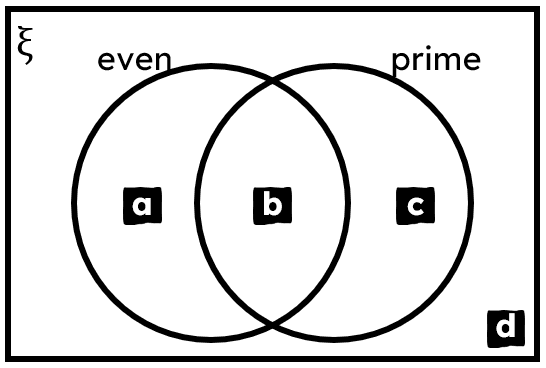
Region a -
104
Region b -
2
Region c -
7
Region d -
77
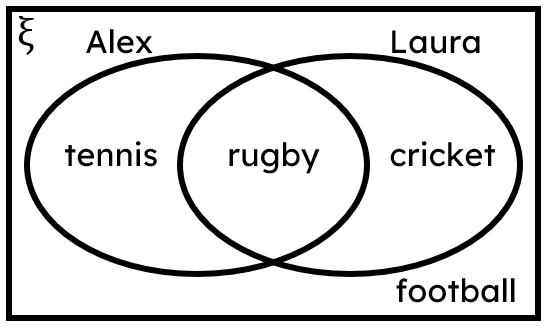
Q2.The Venn diagram shows a selection of sports that Alex and Laura do and do not like. Which of these statements is true?
Q3.This incomplete outcome tree represents all outcomes from spinning spinner X twice and subtracting the outcome of spin 2 from spin 1.
Match each letter to its value in the sample space
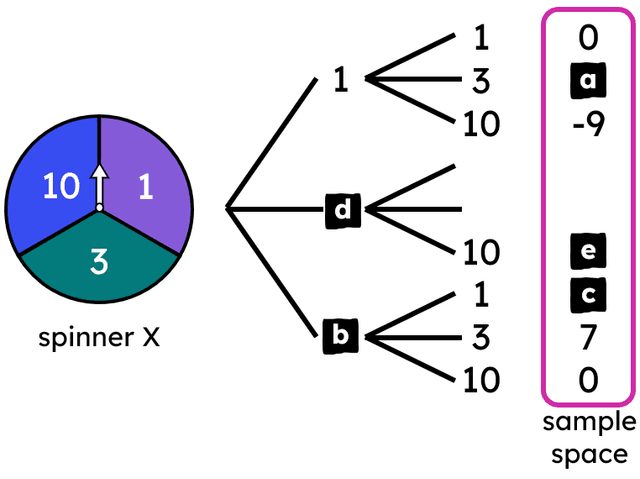
a -
-2
b -
10
c -
9
d -
3
e -
-7
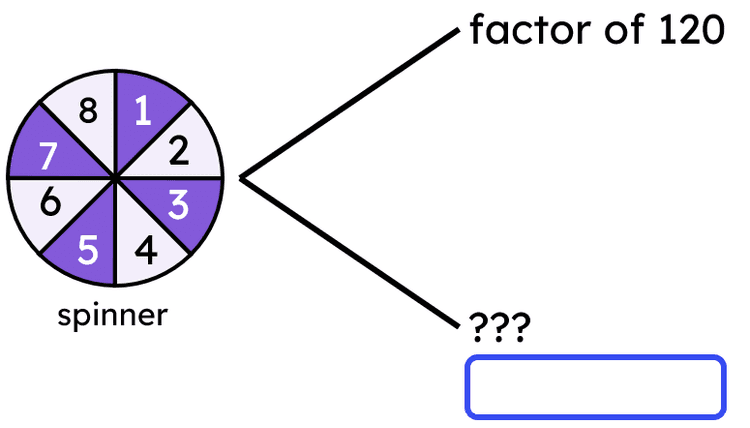
Q4.Trial: spinning this spinner once. Event: factor of 120. This event and its opposite event are represented on an outcome tree. Which outcome should be written inside the box?
Q5.Trial: Spinner A is spun twice and coin is flipped. The outcome of each spin is added together. This incomplete outcome tree shows all the trial's outcomes. Match each letter on the tree to its value.
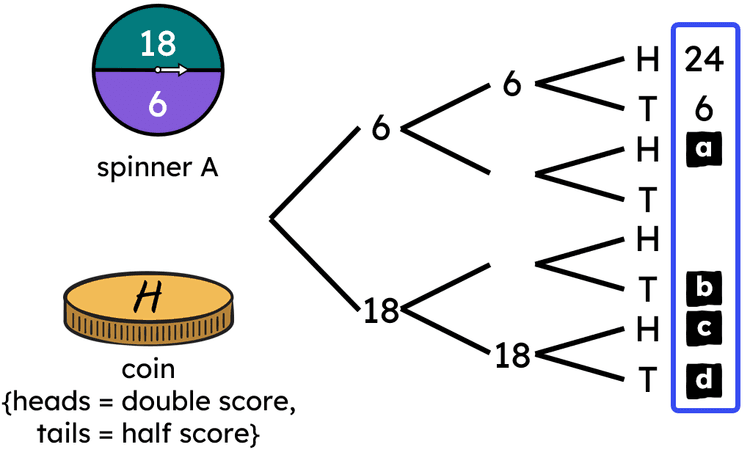
a -
48
b -
12
c -
72
d -
18
Q6.Both the Venn diagram and outcome tree represent the same two events from a trial. Match the outcome from the Venn diagram to the missing outcome from the outcome tree.
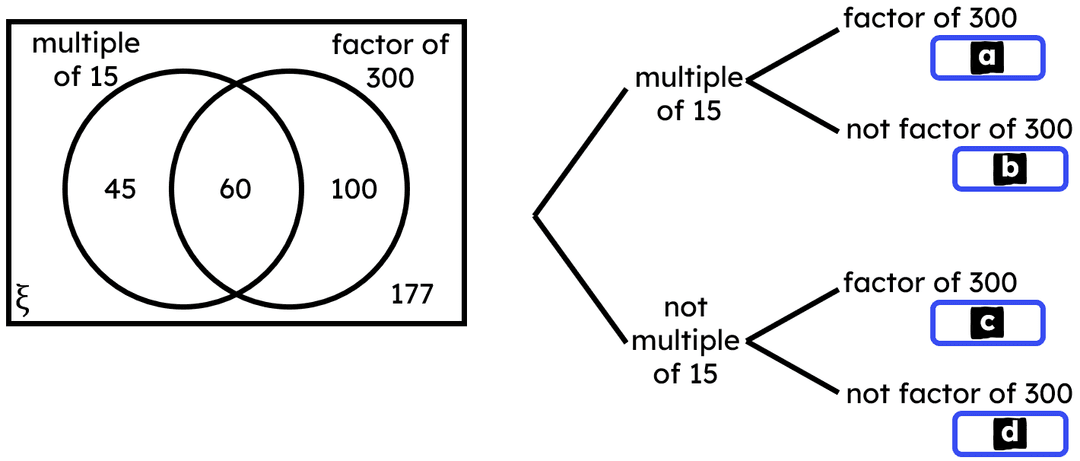
a -
60
b -
45
c -
100
d -
177
Assessment exit quiz
6 Questions
Q1.Which of these statements is true?
Q2.Lucas creates an outcome tree to systematically list all possible three-course meals. The 1st layer of branches will show the starters. The number of branches needed for the 1st layer is .

Q3.Lucas creates an outcome tree to systematically list all possible three-course meals. The 2nd layer of branches will show the mains. The number of branches needed in total for the 2nd layer is .
Q4.This is an incomplete list of outcomes to a three-stage trial. Match each statement to the minimum number of outcomes that completes the sentence.

The first stage of the trial has... -
a minimum of four outcomes.
The second stage of the trial has... -
a minimum of three outcomes.
The third stage of the trial has... -
a minimum of two outcomes.
The whole trial has... -
a minimum of 24 outcomes.
Q5.This Venn diagram and outcome tree both show events for the same trial. Match each letter in the outcome tree to the correct outcome from the Venn diagram.
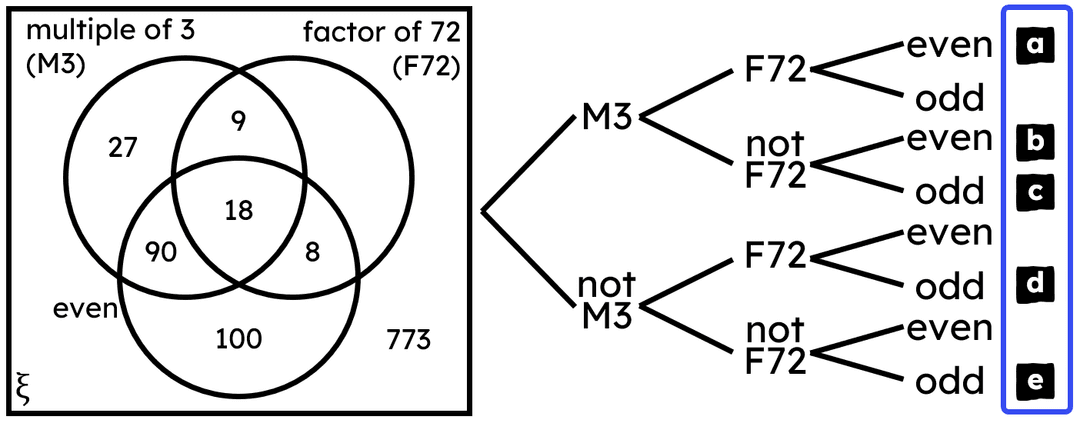
a -
18
b -
90
c -
27
d -
no outcome
e -
773
Q6.This Venn diagram and outcome tree both show events for the same trial. Match each letter in the Venn diagram to the correct outcome from the outcome tree.
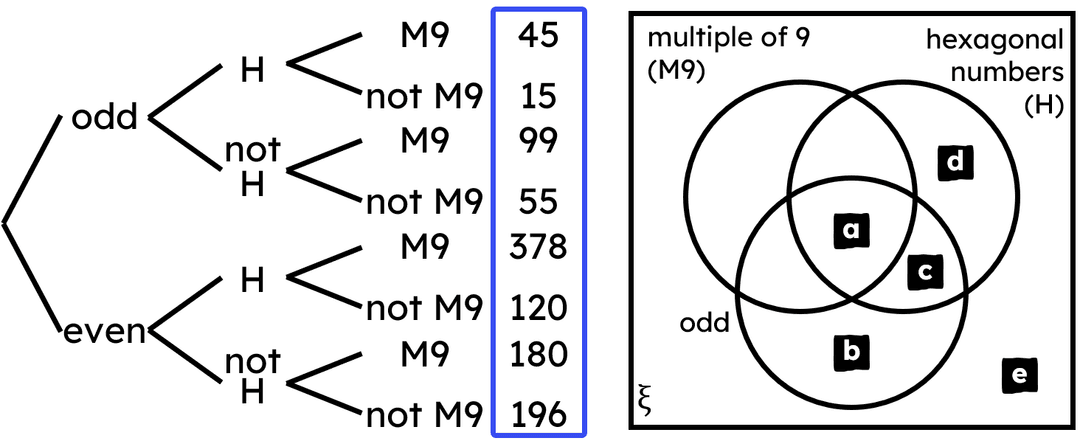
a -
45
b -
55
c -
15
d -
120
e -
196