Myths about teaching can hold you back

- Year 9
Comparing representations of outcomes for two events
I can identify the same outcome across all the different representations.
- Year 9
Comparing representations of outcomes for two events
I can identify the same outcome across all the different representations.
Lesson details
Key learning points
- Fluency in moving between the representations is important.
- Sometimes it is better to display the outcomes using a particular representation.
Keywords
Outcome table - An outcome table is a table that shows all the possible outcomes.
Venn diagram - Venn diagrams are a representation used to diagram statistical/probability questions. Commonly circles are used to represent events.
Common misconception
An outcome tree doesn't have a sample space.
Each representation of the outcomes of a trial have a sample space as a part of it. For an outcome table, the table itself is the sample space. For an outcome tree, a sample space must always be constructed after drawing the two layers of branches.
To help you plan your year 9 maths lesson on: Comparing representations of outcomes for two events, download all teaching resources for free and adapt to suit your pupils' needs...
To help you plan your year 9 maths lesson on: Comparing representations of outcomes for two events, download all teaching resources for free and adapt to suit your pupils' needs.
The starter quiz will activate and check your pupils' prior knowledge, with versions available both with and without answers in PDF format.
We use learning cycles to break down learning into key concepts or ideas linked to the learning outcome. Each learning cycle features explanations with checks for understanding and practice tasks with feedback. All of this is found in our slide decks, ready for you to download and edit. The practice tasks are also available as printable worksheets and some lessons have additional materials with extra material you might need for teaching the lesson.
The assessment exit quiz will test your pupils' understanding of the key learning points.
Our video is a tool for planning, showing how other teachers might teach the lesson, offering helpful tips, modelled explanations and inspiration for your own delivery in the classroom. Plus, you can set it as homework or revision for pupils and keep their learning on track by sharing an online pupil version of this lesson.
Explore more key stage 3 maths lessons from the Probability: possible outcomes unit, dive into the full secondary maths curriculum, or learn more about lesson planning.

Licence
Lesson video
Loading...
Prior knowledge starter quiz
6 Questions
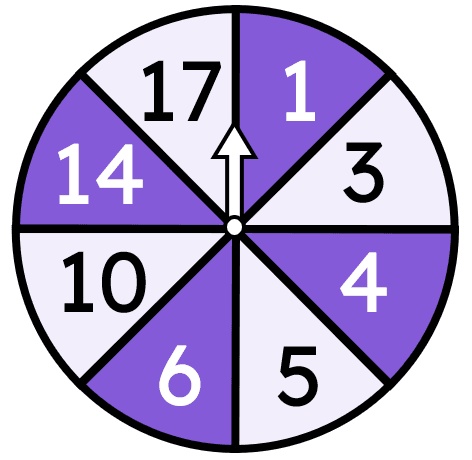
Q1.The number of outcomes on this spinner that are odd numbers is .
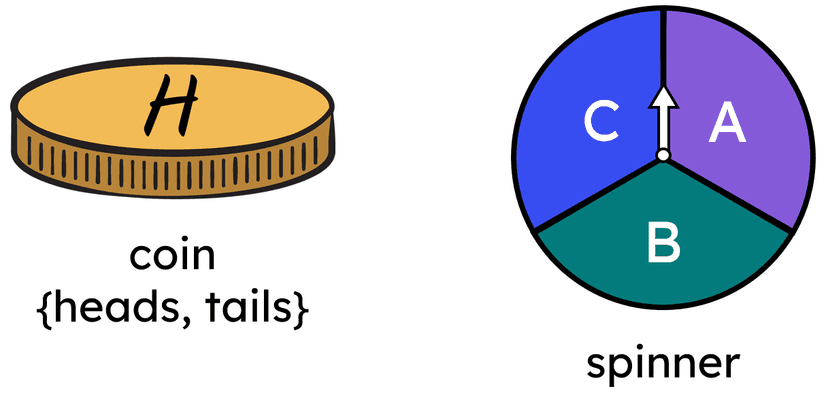
Q2.Trial: flipping the coin and spinning the spinner once each.
Which of these lists of outcomes for the trial show a complete sample space? Use H for 'heads' and T for 'tails'.
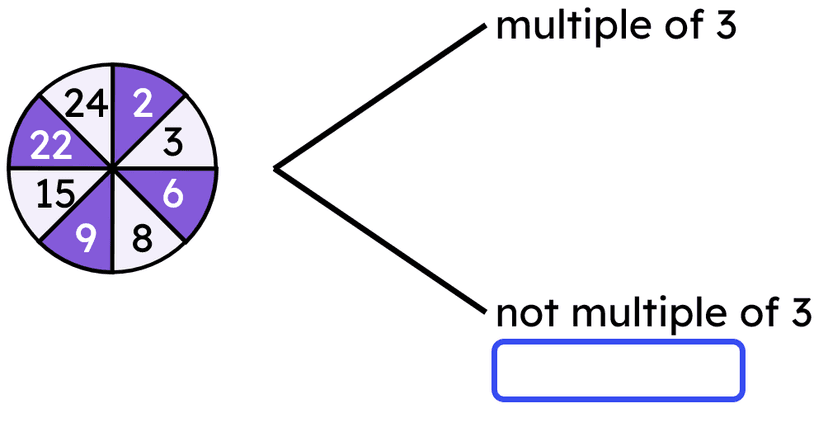
Q3.Trial: spinning this spinner once.
Event: multiple of 3.
Which of these outcomes should be written inside the box?
Q4.Match each number to its correct location on the Venn diagram.
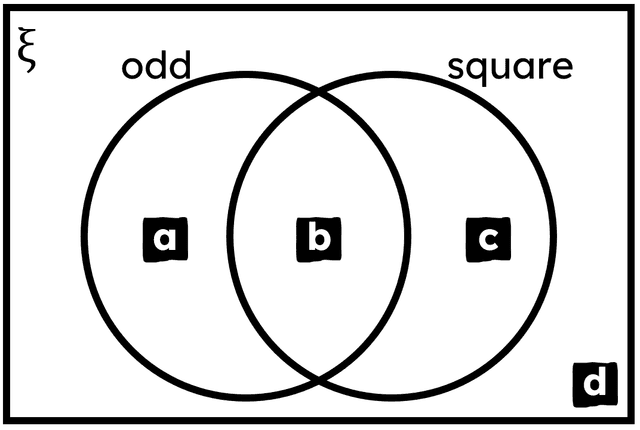
a
b
c
d
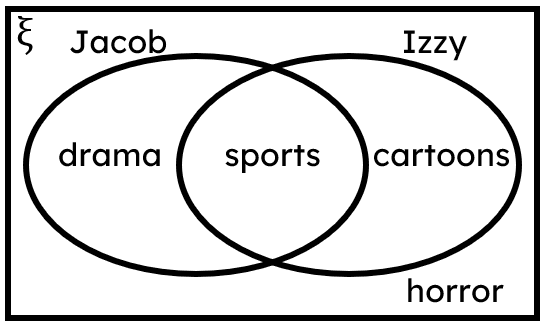
Q5.The Venn diagram shows a selection of types of TV shows that Jacob and Izzy do and do not like.
Which of these statements is true for drama TV shows?
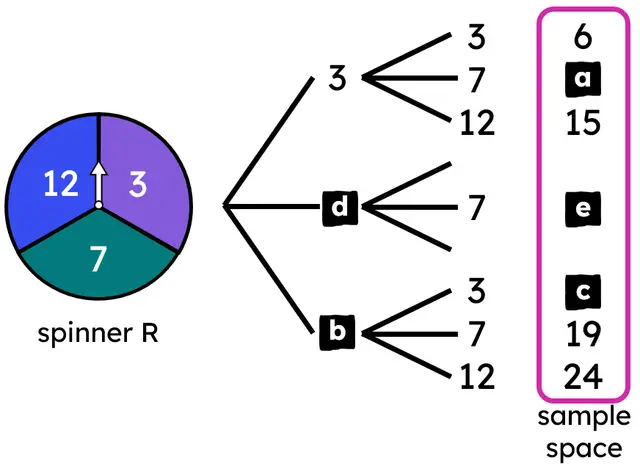
Q6.This incomplete outcome tree represents all outcomes from spinning spinner R twice and adding the results of each spin.
Match each letter to its value in the sample space.
10
12
15
7
14
Assessment exit quiz
6 Questions
Q1.Which of these are helpful when trying to systematically write down all outcomes for a two-stage trial?
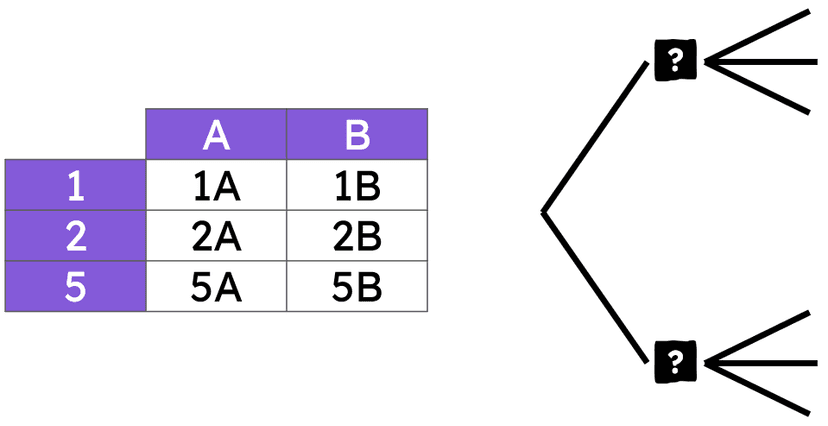
Q2.Both the outcome table and outcome tree represent the same two-stage trial.
Which outcomes go in the two locations marked by a question mark?
Q3.Which statements are correct for this outcome table and outcome tree?
Q4.Both the Venn diagram and outcome tree represent the same two events from a trial.
Match each missing outcome from the outcome tree to an outcome from the Venn diagram
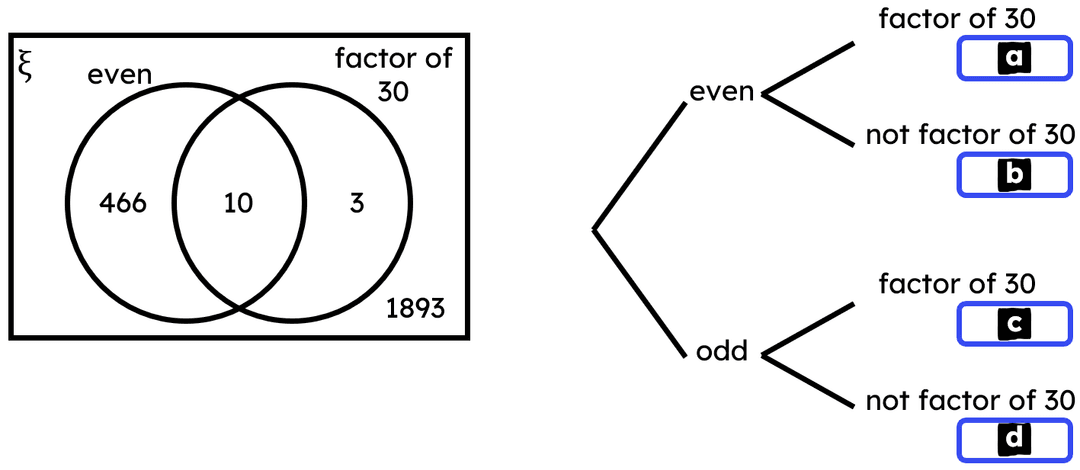
10
466
3
1893
Q5.Both the outcome tree and Venn diagram represent the same two events from a trial.
Match the missing outcome from the Venn diagram to an outcome from the outcome tree.
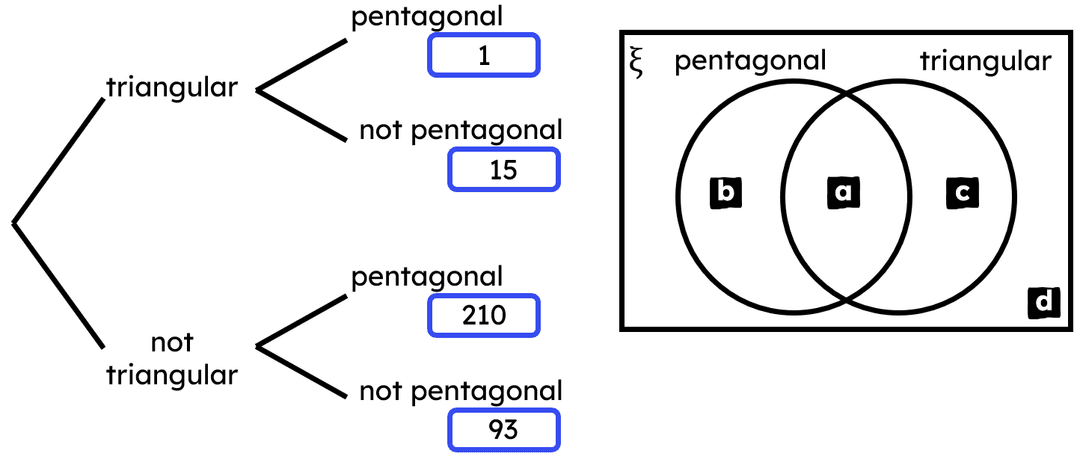
1
210
15
93
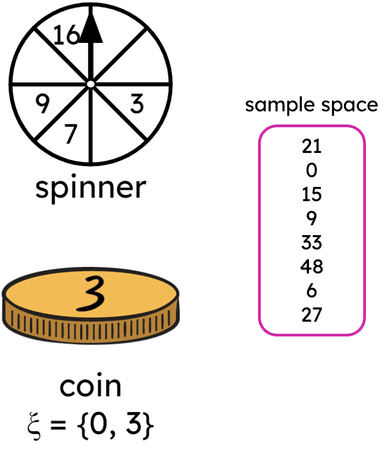
Q6.Trial: Alex will spin this spinner and flip this coin, and then write the product of the two outcomes in the sample space.
Which of these are the missing numbers on the spinner?