Myths about teaching can hold you back

- Year 9
Problem solving with possible outcomes
I can choose an appropriate diagram to display the outcomes for different events.
- Year 9
Problem solving with possible outcomes
I can choose an appropriate diagram to display the outcomes for different events.
Lesson details
Key learning points
- The possible outcomes can be displayed for two or more events using an appropriate diagram.
- The various diagrams can be evaluated and the appropriateness of each diagram decided.
- The likelihood of an outcome can be determined using a mixture of different diagrams.
Keywords
Likelihood - Likelihood describes the chance that a particular event occurs.
Outcome table - An outcome table is a table that shows all the possible outcomes.
Outcome tree - Each branch of an outcome tree shows a possible outcome from an event or from a stage of a trial. The full outcome tree shows all possible outcomes.
Venn diagram - Venn diagrams are a representation used to model statistical/probability questions. Commonly circles are used to represent events.
Common misconception
Outcome tables and outcome trees only work for outcomes that are all equally likely.
Outcome tables can be separated into more rows and columns, and outcome trees split into more branches, to show outcomes that are more or less likely than other ones. This does mean these diagrams do get massive very quickly!
To help you plan your year 9 maths lesson on: Problem solving with possible outcomes, download all teaching resources for free and adapt to suit your pupils' needs...
To help you plan your year 9 maths lesson on: Problem solving with possible outcomes, download all teaching resources for free and adapt to suit your pupils' needs.
The starter quiz will activate and check your pupils' prior knowledge, with versions available both with and without answers in PDF format.
We use learning cycles to break down learning into key concepts or ideas linked to the learning outcome. Each learning cycle features explanations with checks for understanding and practice tasks with feedback. All of this is found in our slide decks, ready for you to download and edit. The practice tasks are also available as printable worksheets and some lessons have additional materials with extra material you might need for teaching the lesson.
The assessment exit quiz will test your pupils' understanding of the key learning points.
Our video is a tool for planning, showing how other teachers might teach the lesson, offering helpful tips, modelled explanations and inspiration for your own delivery in the classroom. Plus, you can set it as homework or revision for pupils and keep their learning on track by sharing an online pupil version of this lesson.
Explore more key stage 3 maths lessons from the Probability: possible outcomes unit, dive into the full secondary maths curriculum, or learn more about lesson planning.

Licence
Lesson video
Loading...
Prior knowledge starter quiz
6 Questions
Q1.The Venn diagram shows the sample space $$\xi$$ = {8, 81, 144, 201}. Match each region to the correct outcome.
a -
8
b -
144
c -
81
d -
201
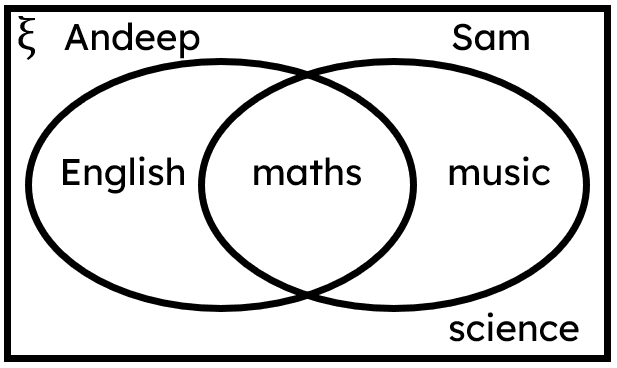
Q2.The Venn diagram shows a selection of subjects that Andeep and Sam enjoy. Which of these statements is true for science?
Q3.Both the Venn diagram and outcome table represent the same two events from a trial. Match each lettered outcome from the outcome table to the correct outcome from the Venn diagram.
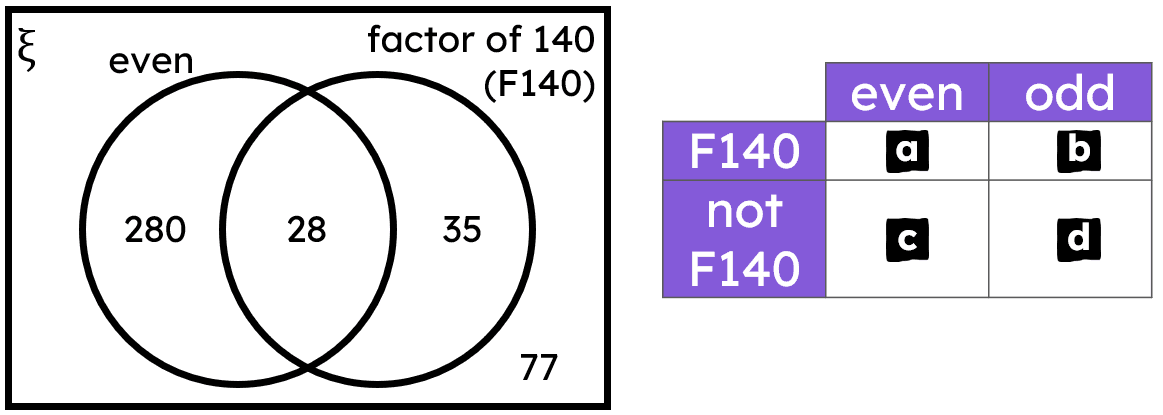
a -
28
b -
35
c -
280
d -
77
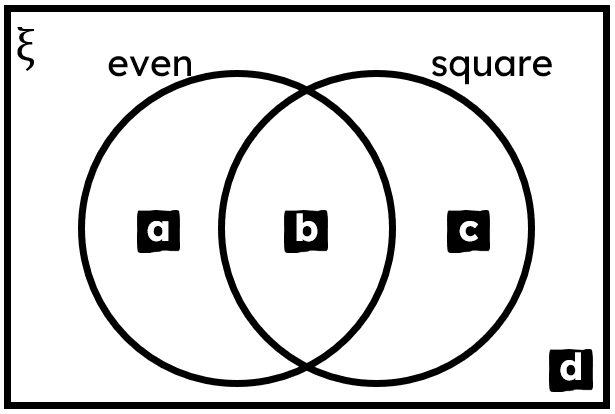
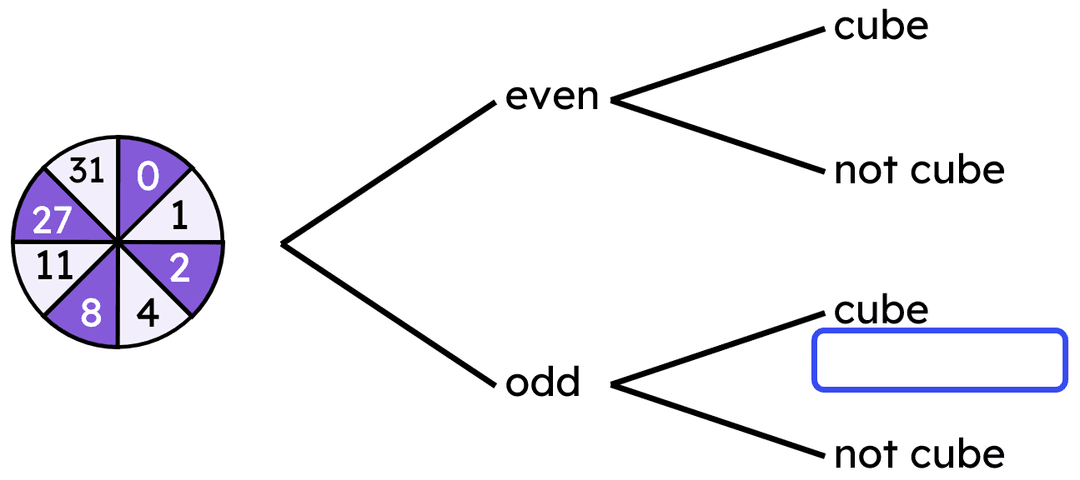
Q4.Trial: spinning this spinner once. Event 1: even number. Event 2: cube number. Which outcomes should be written inside the box?
Q5.Trial: a spinner is spun twice, with the two results multiplied together. Both incomplete diagrams represent the same trial.
Match each letters to the correct outcome.
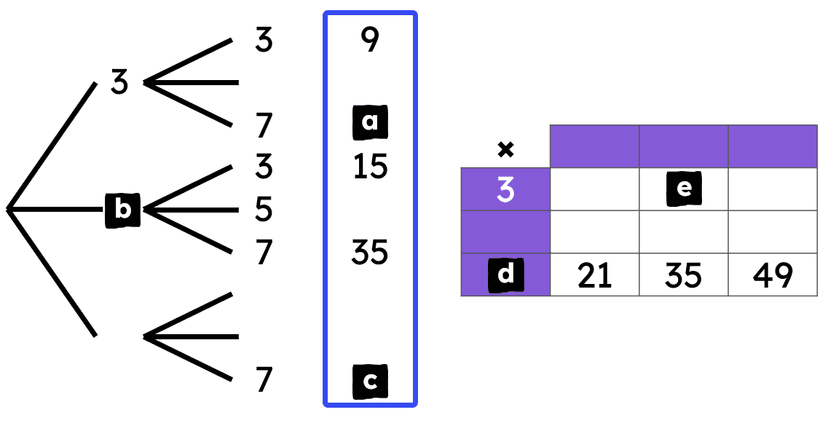
a -
21
b -
5
c -
49
d -
7
e -
15
Q6.Trial: Spinner 1 is spun twice. The outcome of each spin is added together. This incomplete outcome tree shows all outcomes of this trial.
Match each letter to its value in the sample space.
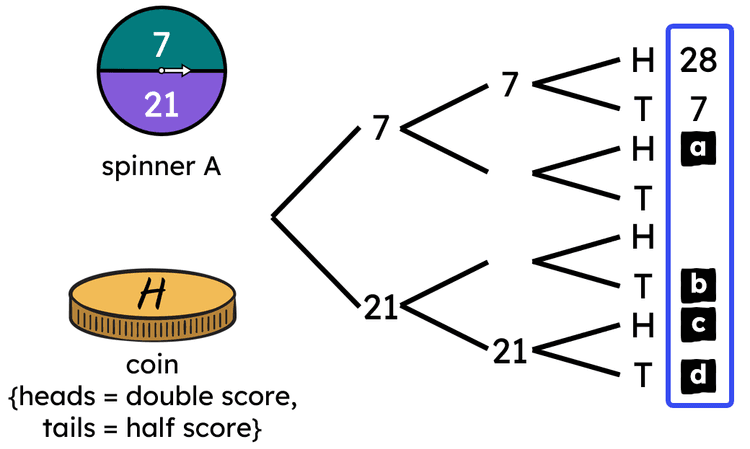
a -
56
b -
14
c -
84
d -
21
Assessment exit quiz
6 Questions
Q1.Trial: The spinner is spun twice. The order of the two outcomes doesn't matter. The incomplete outcome table shows all outcomes of the trial. Match each letter the sample space to its value.
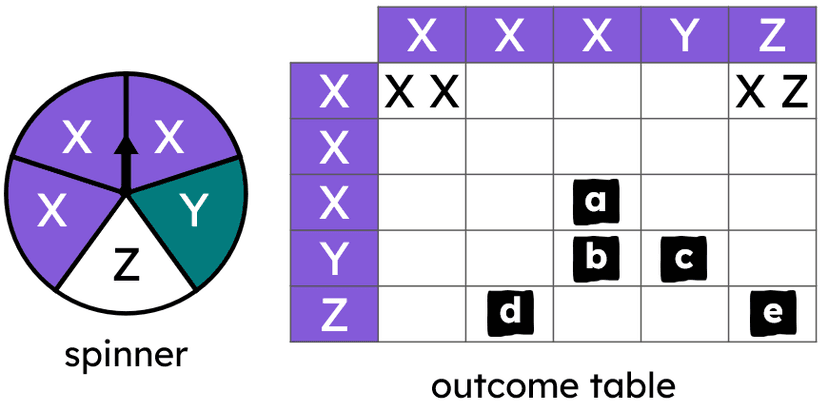
a -
X X
b -
Y X
c -
Y Y
d -
Z X
e -
Z Z
Q2.Trial: The spinner is spun twice. The order of the two outcomes doesn't matter. Which of these statements are correct for this trial?
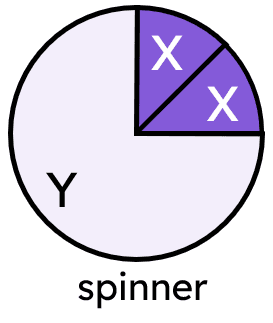
Q3.Trial: The product of two spins of the spinner. This outcome table represents all outcomes of the trial. Match the start of each statement to the correct end of the statement.
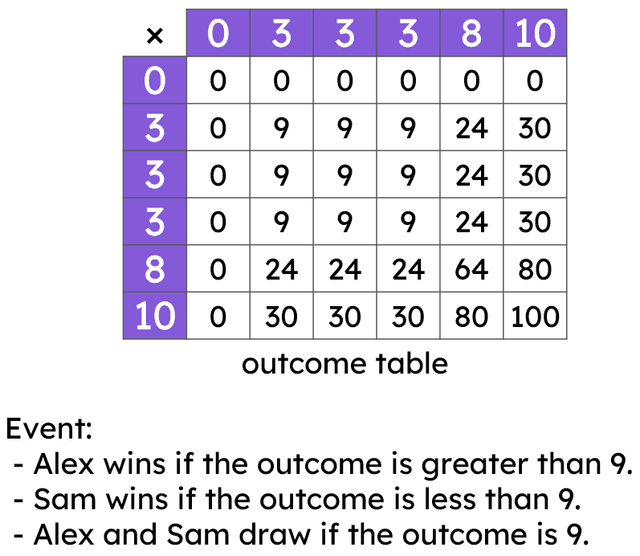
The event that Alex wins... -
is the most likely outcome.
The event that Sam wins... -
is in between the least and most likely outcomes on a likelihood scale
The event that they draw... -
is the least likely outcome.
Q4.Trial: The spinner will be spun once. Which of these statements about one stage of this trial is correct?
Q5.Trial: The spinner will be spun twice, and the order of the two stages does not matter. Match the start of each statement to the correct outcome.
The most common outcome is... -
Y Y
The least common outcome is... -
X X
Y Y appears 1.5× as often as... -
XY
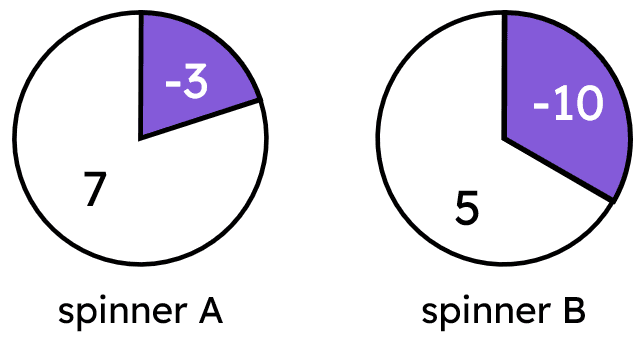
Q6.Trial: Spinner A and B are spun once each. The sum of the two outcomes is found. Which of these statements about the outcomes of this trial are correct?