Myths about teaching can hold you back

- Year 9
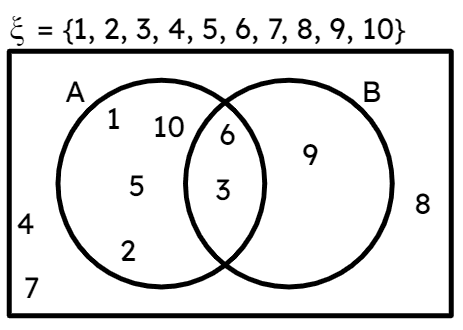
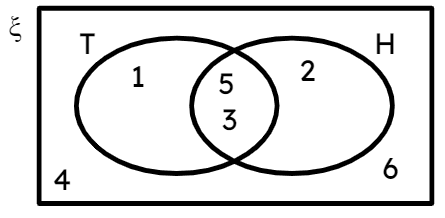
Using a Venn diagram to display outcomes for two events
I can systematically find all the possible outcomes for two events by using a Venn diagram.
- Year 9
Using a Venn diagram to display outcomes for two events
I can systematically find all the possible outcomes for two events by using a Venn diagram.
Lesson details
Key learning points
- Possible outcomes for two events can be shown in a Venn diagram.
- The Venn diagram can be used to generate any of the other models.
- Any of the other outcome diagrams can be used to generate a Venn diagram.
Keywords
Venn diagram - Venn diagrams are a representation used to model statistical/probability questions. Commonly circles are used to represent events.
Common misconception
Pupils may not draw the rectangle in their Venn diagrams.
Refer back to the rectangle hosting all possible outcomes; the sample space and therefore a vital part of a Venn diagram.
To help you plan your year 9 maths lesson on: Using a Venn diagram to display outcomes for two events, download all teaching resources for free and adapt to suit your pupils' needs...
To help you plan your year 9 maths lesson on: Using a Venn diagram to display outcomes for two events, download all teaching resources for free and adapt to suit your pupils' needs.
The starter quiz will activate and check your pupils' prior knowledge, with versions available both with and without answers in PDF format.
We use learning cycles to break down learning into key concepts or ideas linked to the learning outcome. Each learning cycle features explanations with checks for understanding and practice tasks with feedback. All of this is found in our slide decks, ready for you to download and edit. The practice tasks are also available as printable worksheets and some lessons have additional materials with extra material you might need for teaching the lesson.
The assessment exit quiz will test your pupils' understanding of the key learning points.
Our video is a tool for planning, showing how other teachers might teach the lesson, offering helpful tips, modelled explanations and inspiration for your own delivery in the classroom. Plus, you can set it as homework or revision for pupils and keep their learning on track by sharing an online pupil version of this lesson.
Explore more key stage 3 maths lessons from the Probability: possible outcomes unit, dive into the full secondary maths curriculum, or learn more about lesson planning.

Licence
Lesson video
Loading...
Prior knowledge starter quiz
6 Questions
Q1.Select the prime number.
Q2.Which of these statements are true about square numbers?
Q3.Here are all the factors of a number $$x$$. Match each factor with the factor that completes the factor pair.
1 -
24
2 -
12
3 -
8
4 -
6
Q4.Which of these numbers is 48 a multiple of?
Q5.The sample space is the set of all possible from a trial.
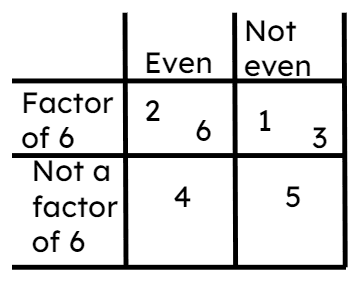
Q6.Which outcome is not a factor of 6 but is even?
Assessment exit quiz
6 Questions
Q1.Which of these is a Venn diagram?
Q2.Use this Venn diagram to match the events to the outcomes.
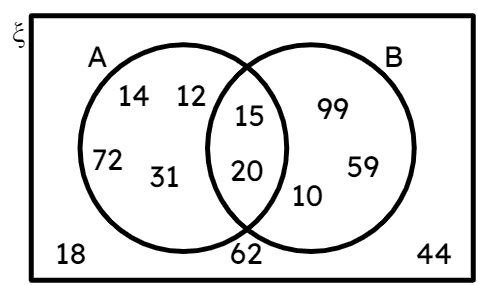
event A -
{12, 14, 15, 20, 31, 72}
event B -
{10, 15, 20, 59, 99}
not event A -
{10, 18, 44, 59, 62, 99}
not event B -
{12, 14, 18, 31, 44, 62, 72}
event A and event B -
{15, 20}
event A or event B -
{10, 12, 14, 15, 20, 31, 59, 72, 99}
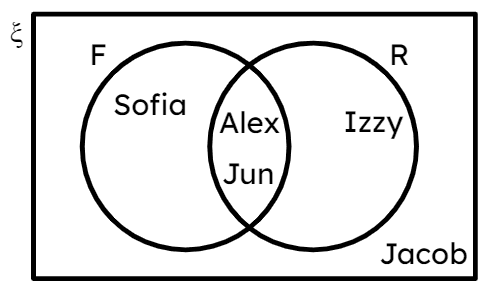
Q3.The Venn diagram shows 5 pupils and whether they play football (F) or play rugby (R). Which pupil plays rugby but not football?
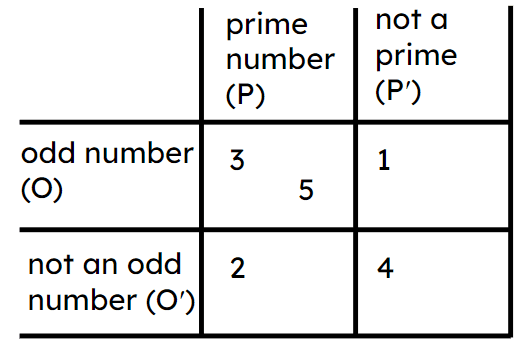
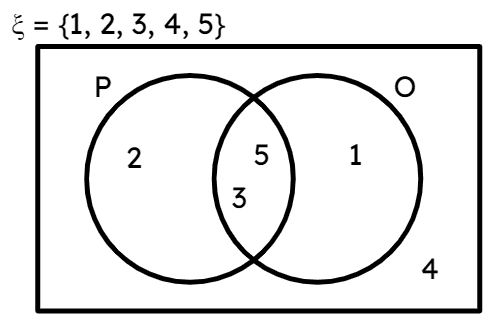
Q4.This Venn diagram shows prime numbers (P) and odd numbers (O). The Venn diagram has two errors. What are they?
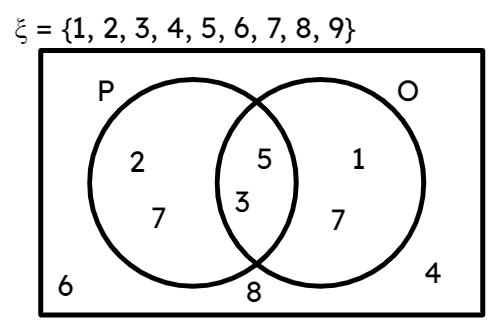
Q5.There are outcomes in the sample space shown in this Venn diagram.
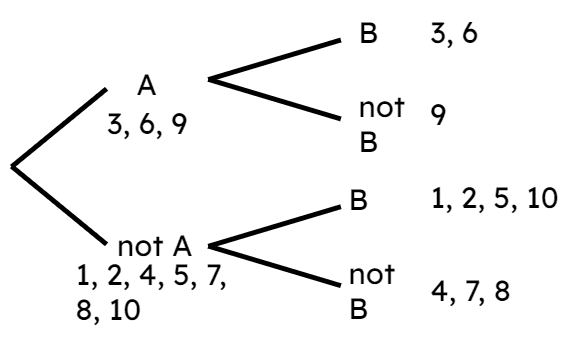
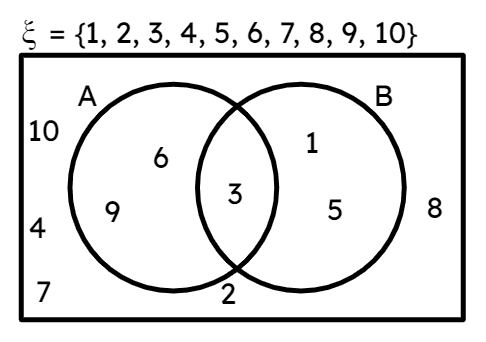
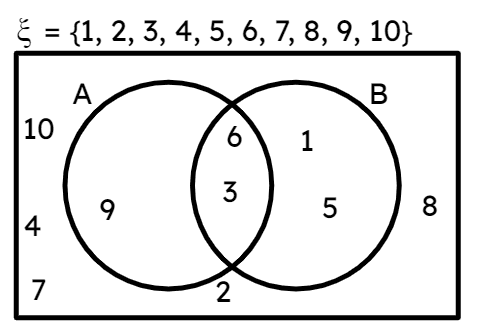
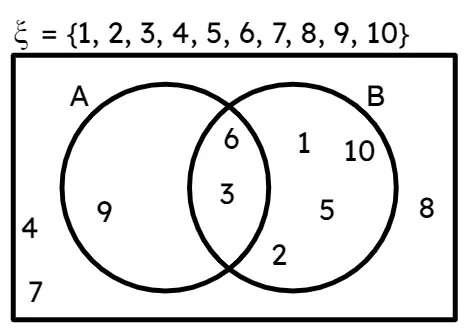
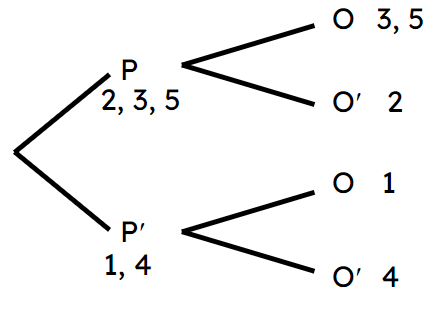
Q6.Which Venn diagram shows the same information as this outcome tree?