Myths about teaching can hold you back

- Year 9
Calculating theoretical probabilities from Venn diagrams (two events)
I can calculate and use theoretical probabilities for combined events using Venn diagrams (2 events).
- Year 9
Calculating theoretical probabilities from Venn diagrams (two events)
I can calculate and use theoretical probabilities for combined events using Venn diagrams (2 events).
Lesson details
Key learning points
- The probability of an outcome can be found by considering a Venn diagram showing all possible outcomes for two events.
- The probability of a set of outcomes can be found by using a Venn diagram showing all possible outcomes for two events.
- The probability of a set of outcomes can be found using a Venn diagram, even when the outcomes are not equally likely.
Keywords
Theoretical probability - A theoretical probability is a probability based on counting the number of desired outcomes from a sample space where all individual outcomes are equally likely.
Venn diagram - Venn diagrams are a representation used to model statistical/probability questions. Commonly circles are used to represent events.
Common misconception
Pupils may struggle with finding the probability of A or B, and may count the outcomes that belong to A and B twice.
If you use an example, such as visiting particular countries, ask the pupils how someone would respond to the question 'have you visited X or Y' if they have in fact visited both countries.
To help you plan your year 9 maths lesson on: Calculating theoretical probabilities from Venn diagrams (two events), download all teaching resources for free and adapt to suit your pupils' needs...
To help you plan your year 9 maths lesson on: Calculating theoretical probabilities from Venn diagrams (two events), download all teaching resources for free and adapt to suit your pupils' needs.
The starter quiz will activate and check your pupils' prior knowledge, with versions available both with and without answers in PDF format.
We use learning cycles to break down learning into key concepts or ideas linked to the learning outcome. Each learning cycle features explanations with checks for understanding and practice tasks with feedback. All of this is found in our slide decks, ready for you to download and edit. The practice tasks are also available as printable worksheets and some lessons have additional materials with extra material you might need for teaching the lesson.
The assessment exit quiz will test your pupils' understanding of the key learning points.
Our video is a tool for planning, showing how other teachers might teach the lesson, offering helpful tips, modelled explanations and inspiration for your own delivery in the classroom. Plus, you can set it as homework or revision for pupils and keep their learning on track by sharing an online pupil version of this lesson.
Explore more key stage 3 maths lessons from the Probability: theoretical probabilities unit, dive into the full secondary maths curriculum, or learn more about lesson planning.

Licence
Lesson video
Loading...
Prior knowledge starter quiz
6 Questions
Q1.There are two trials. In Trial 1, a fair spinner with {A, B} is spun twice. In Trial 2, a fair spinner with {B, C} is spun twice. Which statement is true?
Q2.If the probability of an event (A) is $$/frac{2}{5}$$, and the experiment is repeated 25 times, what is the theoretical number of times event (A) will occur?
Q3.A random character is selected from the word MISSISSIPPI, which of the following statements are true?
Q4.If the probability of an event (A) is $$/frac{1}{8}$$, and the experiment is repeated 40 times, what is the theoretical number of times event (A) will occur?
Q5.If you roll a fair six sided die twice and sum the results, what is the most likely sum below?
Q6.If you roll a fair six sided die twice and sum the results, what is the most likely sum below?
Assessment exit quiz
6 Questions
Q1.Using this Venn diagram, what is the probability of an object being randomly selected from B?
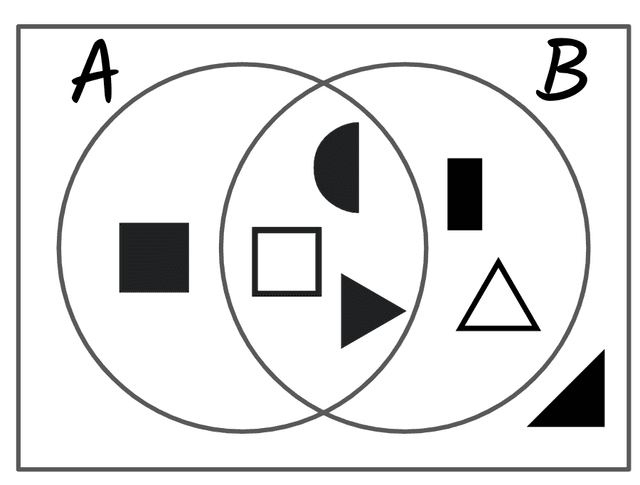
Q2.Using this Venn diagram, what is the probability of an object being randomly selected that is in A and B?
Q3.Using the diagram, what is P(A and not B)?
Q4.Using the diagram, what is P(not A and not B)?
Q5.Using the diagram, what is P(not A and not B)?
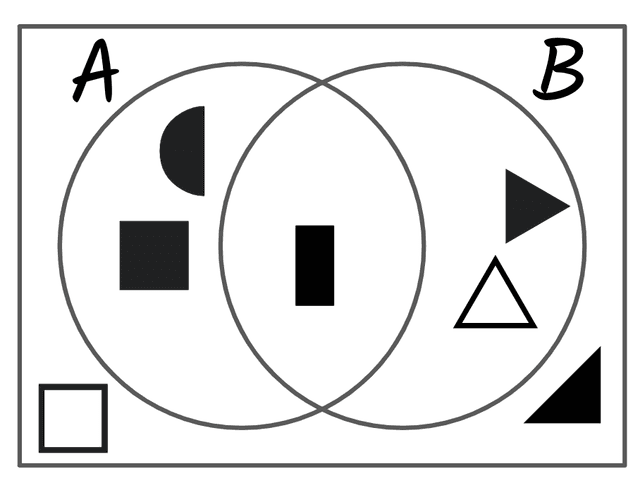
Q6.Using the diagram, what is P(A and B)?