Myths about teaching can hold you back

- Year 9
Comparing multiple representations to calculate theoretical probabilities
I can compare and contrast the usefulness of the different representations when calculating theoretical probabilities.
- Year 9
Comparing multiple representations to calculate theoretical probabilities
I can compare and contrast the usefulness of the different representations when calculating theoretical probabilities.
Lesson details
Key learning points
- The probability of an outcome can be calculated from each representation.
- Different representations show the same information in different ways.
- Some representations may be easier to use than others, depending on the context.
Keywords
Frequency - The frequency is the number of times an event occurs; or the number of individuals (people, animals, etc) with some specific property.
Sample space - A sample space is all the possible outcomes of a trial. A sample space diagram is a systematic way of producing a sample space.
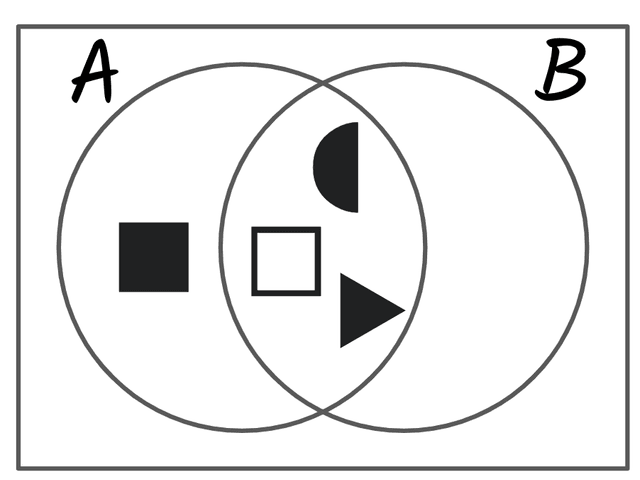
Venn diagram - Venn diagrams are a representation used to model statistical/probability questions. Commonly circles are used to represent events.
Theoretical probability - Theoretical probability is a probability based on counting the number of desired outcomes from a sample space where all individual outcomes are equally likely.
Probability tree - Each branch of a probability tree shows a possible outcome from an event or from a stage of a trial, along with the probability of that outcome happening.
Common misconception
Venn diagrams are useful when generating a complete list of outcomes and showing the probabilities of that list.
Venn diagrams can be very useful when categorising already known outcomes into events. The Venn diagram can then be used to calculate probabilities. However, Venn diagrams are not as useful when generating a list of outcomes.
To help you plan your year 9 maths lesson on: Comparing multiple representations to calculate theoretical probabilities, download all teaching resources for free and adapt to suit your pupils' needs...
To help you plan your year 9 maths lesson on: Comparing multiple representations to calculate theoretical probabilities, download all teaching resources for free and adapt to suit your pupils' needs.
The starter quiz will activate and check your pupils' prior knowledge, with versions available both with and without answers in PDF format.
We use learning cycles to break down learning into key concepts or ideas linked to the learning outcome. Each learning cycle features explanations with checks for understanding and practice tasks with feedback. All of this is found in our slide decks, ready for you to download and edit. The practice tasks are also available as printable worksheets and some lessons have additional materials with extra material you might need for teaching the lesson.
The assessment exit quiz will test your pupils' understanding of the key learning points.
Our video is a tool for planning, showing how other teachers might teach the lesson, offering helpful tips, modelled explanations and inspiration for your own delivery in the classroom. Plus, you can set it as homework or revision for pupils and keep their learning on track by sharing an online pupil version of this lesson.
Explore more key stage 3 maths lessons from the Probability: theoretical probabilities unit, dive into the full secondary maths curriculum, or learn more about lesson planning.

Licence
Lesson video
Loading...
Prior knowledge starter quiz
5 Questions
Q1.In a fair six-sided die, what is the probability of rolling a 6 and getting a head in a single toss of a fair coin?
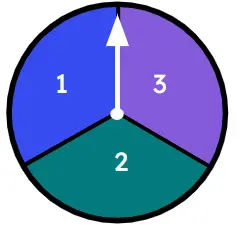
Q2.What is the probability that this spinner will land on an odd number?
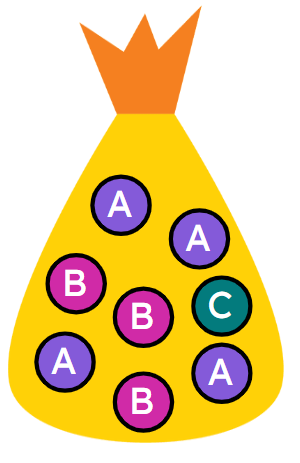
Q3.What is the probability that the letter B is selected at random from this bag?
Q4.A coin is flipped three times. Which outcome is missing from the following sample space? ξ = {HHH, HHT, HTH, HTT, , THT, TTH, TTT}
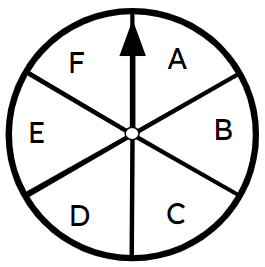
Q5.What is the probability of the spinner landing on either A or B?
Assessment exit quiz
6 Questions
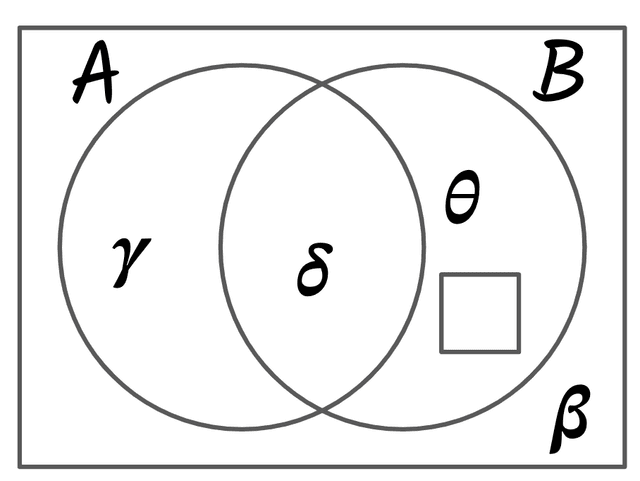
Q1.If Set A = {𝜸, 𝜹} and Set B = {𝞵,𝜹, 𝜽}, what symbol is missing from the Venn diagram?
Q2.Which of the following represents set B?
Q3.Which of the following represents set A?
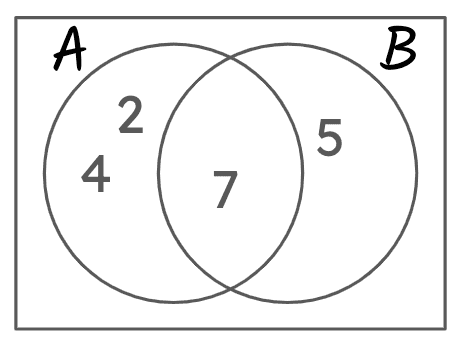
Q4.If set A = {2,4,7} and set B = {5}, what is the error in the diagram?
Q5.Which of the following is a correct statement about this diagram
Q6.Use the Venn diagram to write the probability P(only A)