Myths about teaching can hold you back


- Year 7
Representing a multiplicative relationship
I can use a double number line to represent a multiplicative relationship and connect to other known representations.


- Year 7
Representing a multiplicative relationship
I can use a double number line to represent a multiplicative relationship and connect to other known representations.
These resources were made for remote use during the pandemic, not classroom teaching.
Switch to our new teaching resources now - designed by teachers and leading subject experts, and tested in classrooms.
Lesson details
Key learning points
- A bar model is a representation of a multiplicative relationship.
- A double number line is a representation of a multiplicative relationship.
- A straight line graph is a representation of a multiplicative relationship.
Keywords
Proportionality - Proportionality means when variables are in proportion if they have a constant multiplicative relationship.
Ratio - A ratio shows the relative sizes of 2 or more values and allows you to compare a part with another part in a whole.
Common misconception
Both lines of a double number line must start at zero and these zeros must be aligned.
When drawing double number lines, ensure to align the zeros and the known equivalents. Showing how a graph is formed from a DNL can help.
To help you plan your year 7 maths lesson on: Representing a multiplicative relationship, download all teaching resources for free and adapt to suit your pupils' needs...
To help you plan your year 7 maths lesson on: Representing a multiplicative relationship, download all teaching resources for free and adapt to suit your pupils' needs.
The starter quiz will activate and check your pupils' prior knowledge, with versions available both with and without answers in PDF format.
We use learning cycles to break down learning into key concepts or ideas linked to the learning outcome. Each learning cycle features explanations with checks for understanding and practice tasks with feedback. All of this is found in our slide decks, ready for you to download and edit. The practice tasks are also available as printable worksheets and some lessons have additional materials with extra material you might need for teaching the lesson.
The assessment exit quiz will test your pupils' understanding of the key learning points.
Our video is a tool for planning, showing how other teachers might teach the lesson, offering helpful tips, modelled explanations and inspiration for your own delivery in the classroom. Plus, you can set it as homework or revision for pupils and keep their learning on track by sharing an online pupil version of this lesson.
Explore more key stage 3 maths lessons from the Understanding multiplicative relationships: fractions and ratio unit, dive into the full secondary maths curriculum, or learn more about lesson planning.

Licence
Prior knowledge starter quiz
6 Questions
Q1.Which of the following show this ratio or an equivalent ratio?

Q2.A __________ shows the relative sizes of 2 or more values and allows you to compare a part with another part in a whole.
Q3.Identify the equivalent ratios.

Q4.The table shows the proportion of red to green. Which of these also correctly describe this proportion?

Q5.For every 2 As there are 5 Bs. If there are 35 letters in total, how many Bs are there?
Q6.For every 12 As there are 4 Bs. If there are 4 letters in total, how many Bs are there?
Assessment exit quiz
6 Questions
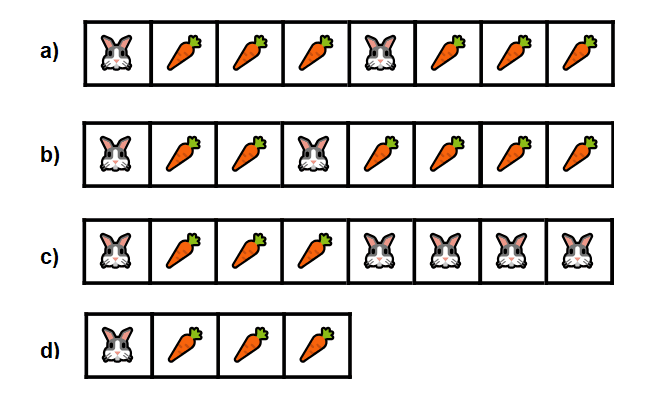
Q1.Which shows the ratio "For every 2 rabbits (R), there is 1 carrot(C)" ?

Q2.Select the correct statement for drawing double number lines.
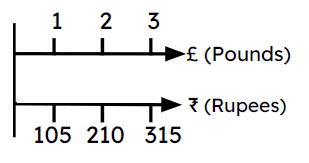
Q3.Using the double number line, identify the correct ratio.

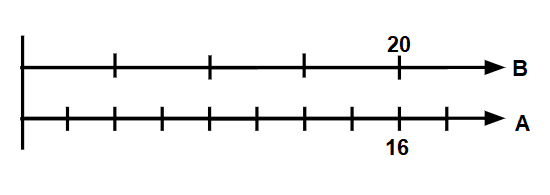
Q4.Here is a double number line. Which of the following are equivalent to this double number line?

Q5.Match the graph with the proportion it represents.

a) -
For every $$x$$, there is 1 $$y$$
b) -
For every 6 $$x$$s, there are 21 $$y$$s
c) -
For every 6 $$x$$s, there are 42 $$y$$s
d) -
For every 6 $$x$$s, there are 9 $$y$$s
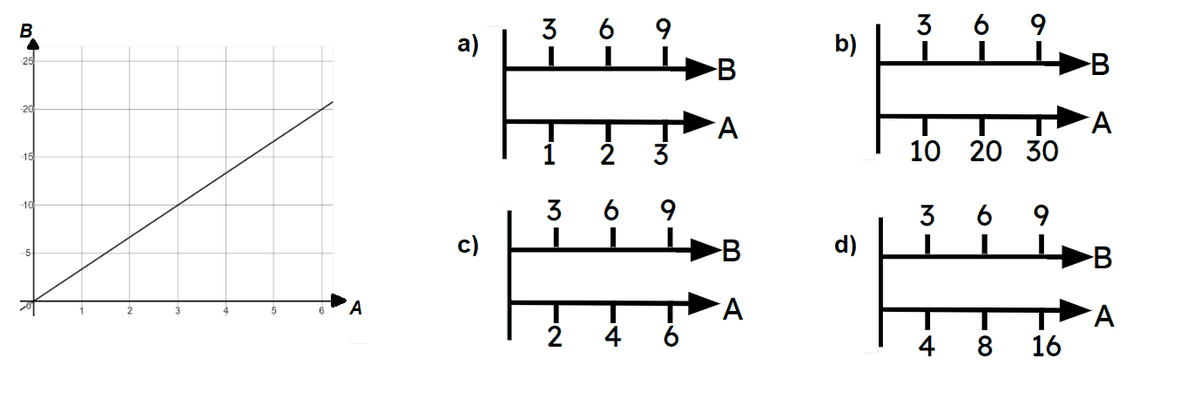
Q6.Which of the double number lines are equivalent to the graph?


