New
New
Year 8

Multiplicative relationships presented graphically

I can use a graph to represent a multiplicative relationship and connect to other known representations.

New
New
Year 8

Multiplicative relationships presented graphically

I can use a graph to represent a multiplicative relationship and connect to other known representations.

Lesson details

Key learning points

  1. A multiplicative relationship given algebraically can be represented on a graph.
  2. From the graph you it is possible to find one value given another.
  3. From a graph it is possible to describe the multiplicative relationship.

Common misconception

Incorrectly drawing a scaled axis is common.

Use the approach where pupils count the number of intervals of the scale and divide the difference bewteen the intervals. For example, if there are 5 intervals and the difference is between 20 and 30, they divide 10 by 2, so each interval is 2

Keywords

  • Proportionality - Proportionality means when variables are in proportion if they have a constant multiplicative relationship.

  • Ratio - A ratio shows the relative sizes of two or more values and allows you to compare a part with another part in a whole.

  • Equivalent fractions - Two fractions are equivalent if they have the same value

A chanting approach when plotting the numbers on the axis allows pupils to see equal intervals and the final plotted value works correctly. This approach works equally well when an incorrect scale is chosen so pupils can see the final plotted value does not work with the incorrect interval.
Teacher tip

Licence

This content is © Oak National Academy Limited (2024), licensed on Open Government Licence version 3.0 except where otherwise stated. See Oak's terms & conditions (Collection 2).

Loading...

6 Questions

Q1.
$$\frac{3}{4}$$ and $$\frac{9}{12}$$ are examples of fractions as they have the same value.
Correct Answer: equivalent, Equivalent
Q2.
Select all the fractions that are equivalent to the fraction of this grid that is shaded.
An image in a quiz
Correct answer: $$\frac{19}{20}$$
$$\frac{19}{100}$$
Correct answer: $$\frac{38}{40}$$
Correct answer: $$\frac{76}{80}$$
Correct answer: $$\frac{95}{100}$$
Q3.
Select the fractions that are equivalent to $$\frac{7}{20}$$.
$$\frac{7}{200}$$
$$\frac{9}{22}$$
Correct answer: $$\frac{14}{40}$$
Correct answer: $$\frac{35}{100}$$
$$\frac{3}{20}$$
Q4.
Match each percentage calculation to its answer.
Correct Answer:20% of 500,100

100

Correct Answer:30% of 870,261

261

Correct Answer:10% of 750,75

75

Correct Answer:30% of 650,195

195

Correct Answer:60% of 940,564

564

Correct Answer:5% of 60,3

3

Q5.
35% of 980 is .
Correct Answer: 343
Q6.
99% of 780 is .
Correct Answer: 772.2

6 Questions

Q1.
Which of the following are equivalent to 20%?
Correct answer: 0.2
Correct answer: 0.20
$$\frac{1}{4}$$
Correct answer: $$\frac{1}{5}$$
Q2.
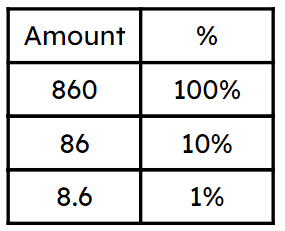
Use the ratio table to help you work out 31% of 860.
An image in a quiz
Correct Answer: 266.6
Q3.
Use the double number line to work out 55% of 700.
An image in a quiz
Correct Answer: 385
Q4.
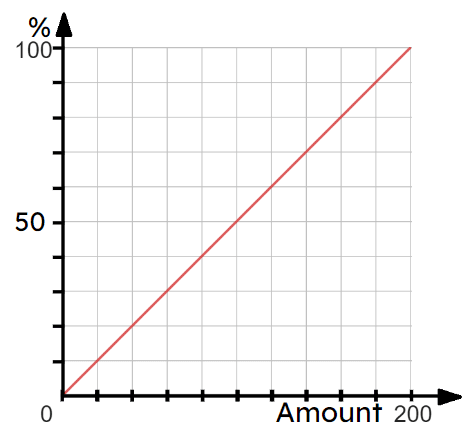
The amount that represents 100% on this graph is .
An image in a quiz
Correct Answer: 200, two hundred
Q5.
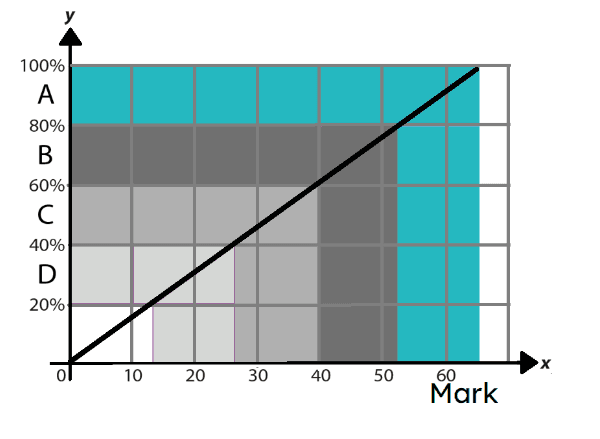
The graph shows the grades achieved by pupils in a maths test. Aisha earned 61 marks in the test. What grade did Aisha achieve?
An image in a quiz
Correct answer: A
B
C
D
E
Q6.
Match each mark or percentage with the correct information from the graph.
An image in a quiz
Correct Answer:34 marks,Grade C

Grade C

Correct Answer:34%,Grade D

Grade D

Correct Answer:45 marks,Grade B

Grade B

Correct Answer:45%,Approximately 29 marks

Approximately 29 marks

Correct Answer:60 marks,Grade A

Grade A

Correct Answer:60%,Approximately 40 marks

Approximately 40 marks