icon-background-square
New
New
Year 10
Foundation

Calculating summary statistics from a grouped frequency table

I can calculate the median, mode and range from a grouped frequency table.

icon-background-square
New
New
Year 10
Foundation

Calculating summary statistics from a grouped frequency table

I can calculate the median, mode and range from a grouped frequency table.

warning

These resources will be removed by end of Summer Term 2025.

Switch to our new teaching resources now - designed by teachers and leading subject experts, and tested in classrooms.

Lesson details

Key learning points

  1. The median and mode are measures of central tendency.
  2. The range is a measure of the spread of the data.
  3. Calculating these from a grouped frequency table may be easier when the data set is very large.

Keywords

  • Interval - An interval is all the values between two points.

  • Modal class - The modal class is the interval, or group of values, with the highest frequency in a data set.

  • Median class - The median class is the class which contains the central (middle) datum when the data are in numerical order.

Common misconception

That the interval widths need to be constant, or conversely that they can be anything.

If interested in people's ages it may be that decades makes sense once over 30 but that significant ages such as 16, 18 and 21 should form boundaries, depending on context. Encourage critical thinking for data with unequal intervals.

When talking through tables always look at the interpretation of that table and link with what the summary statistic you are looking at means. Linking to context is really helpful to stop it becoming process driven and risk blurring of methods later.
speech-bubble
Teacher tip
copyright

Licence

This content is © Oak National Academy Limited (2024), licensed on

except where otherwise stated. See Oak's terms & conditions (Collection 2).

Lesson video

Loading...

6 Questions

Q1.
Which of these describes the mode of a data set.
It is the sum of the values divided by the number of values.
It is the central piece of data when the data are in order of size.
Correct answer: It is value that appears most frequently in a data set.
Two values in a data set that occur most frequently an equal number of times.
Q2.
Match each summary statistic to its value for the data set: 2, 2, 2, 4, 7, 19
Correct Answer:mean,6
tick

6

Correct Answer:median,3
tick

3

Correct Answer:mode,2
tick

2

Correct Answer:range,17
tick

17

Q3.
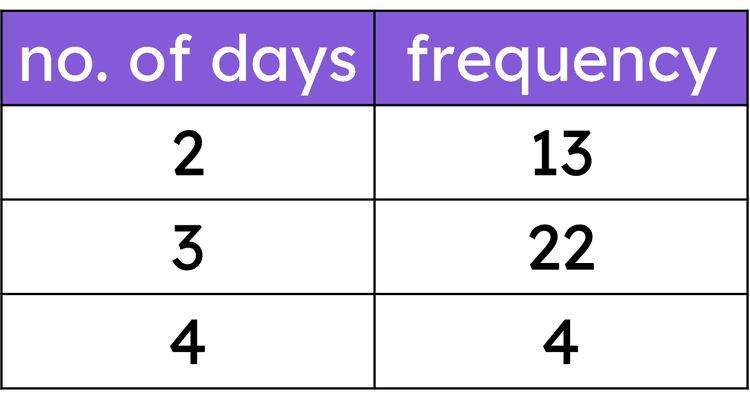
Which of these statements are correct for this data set shown in a frequency table?
An image in a quiz
Correct answer: The modal value is 3.
The modal value is 4.
The modal value is 22.
Correct answer: The range is 2.
The range is 18.
Q4.
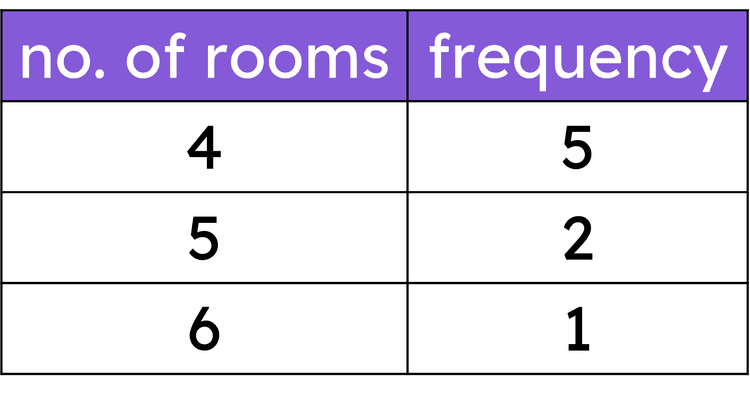
The table shows the number of rooms in some flats in a block of flats. The mean number of rooms in this data set is rooms.
An image in a quiz
Correct Answer: 4.5, 9/2, 4.5 rooms
Q5.
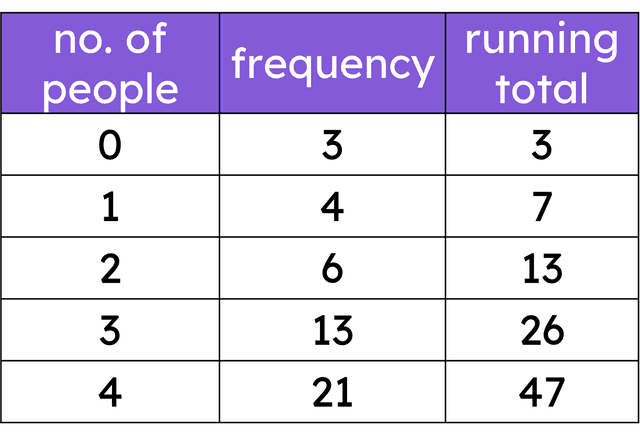
The median number of people in this data set is people.
An image in a quiz
Correct Answer: 3, 3 people
Q6.
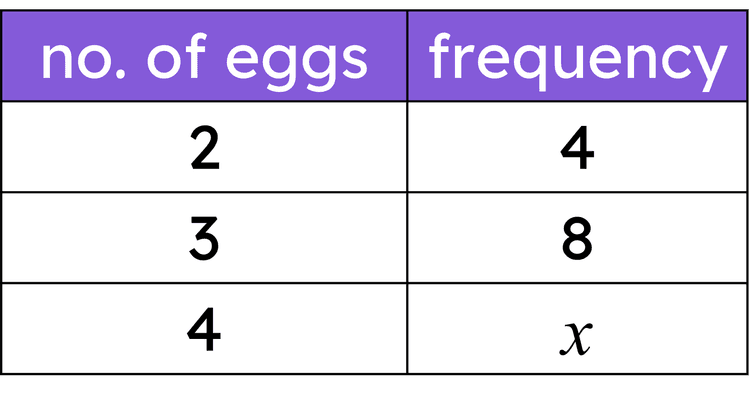
Chocolate eggs are sold in boxes of either 2, 3, or 4. The number of boxes with each number of eggs is recorded. The mean of this data set is 3.5 eggs. The value of $$x$$ is .
An image in a quiz
Correct Answer: 20, twenty

6 Questions

Q1.
Match each phrase to its definition.
Correct Answer:modal class,the interval with the highest frequency in a data set
tick

the interval with the highest frequency in a data set

Correct Answer:median class,the interval which contains the central datum in an ordered data set
tick

the interval which contains the central datum in an ordered data set

Correct Answer:mode,the most frequent data value in a data set
tick

the most frequent data value in a data set

Q2.
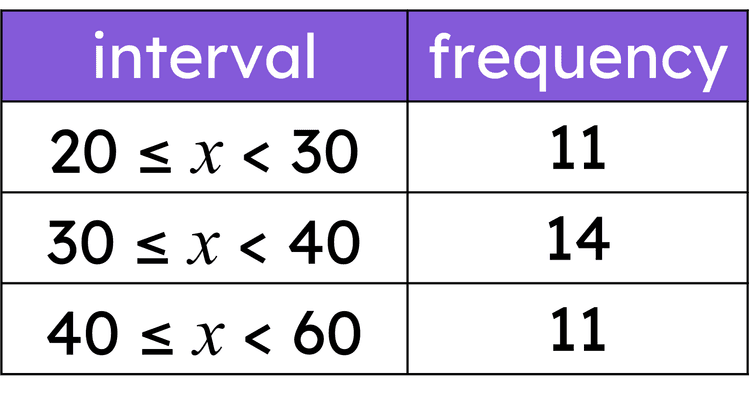
What is the modal class of this data set?
An image in a quiz
11
14
35
Correct answer: $$30 \leq x < 40 $$
30 and 40
Q3.
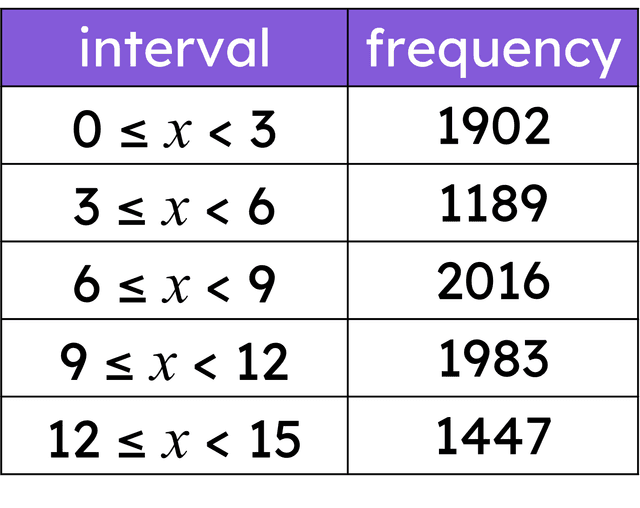
This data set only contains integers. Which of these could be data points in the modal class?
An image in a quiz
Correct answer: 6
Correct answer: 7
7.5
Correct answer: 8
9
Q4.
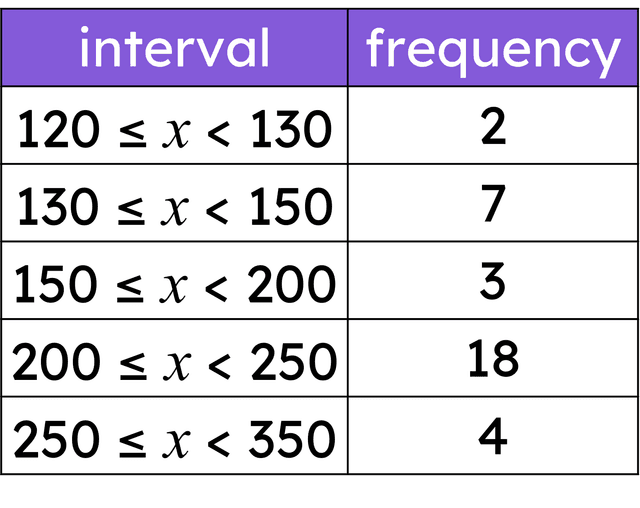
The maximum possible range of this data set is .
An image in a quiz
Correct Answer: 230
Q5.
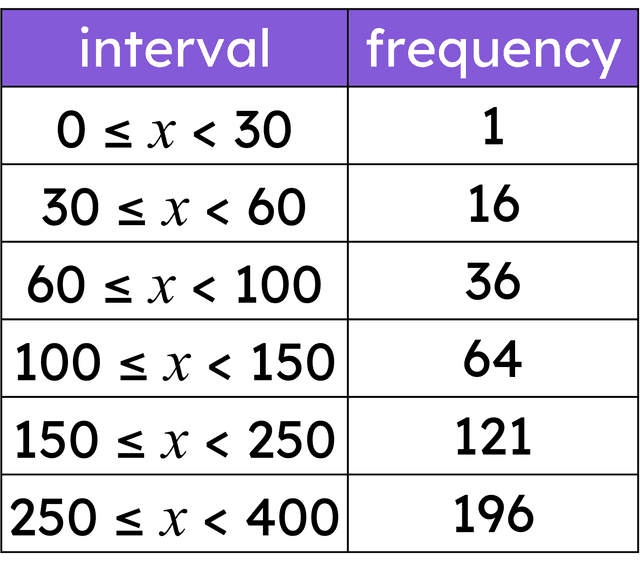
The average expected range of this data set is .
An image in a quiz
Correct Answer: 310
Q6.
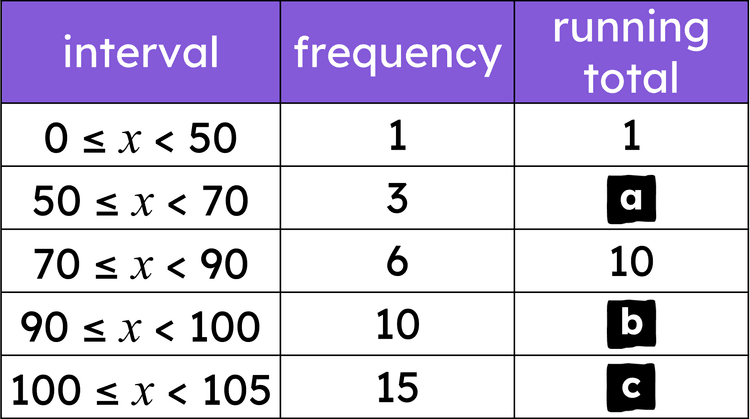
Match each piece of information to its value.
An image in a quiz
Correct Answer:a,4
tick

4

Correct Answer:b,20
tick

20

Correct Answer:c,35
tick

35

Correct Answer:median class,$$90 \leq x < 100 $$
tick

$$90 \leq x < 100 $$

Correct Answer:modal class,$$100 \leq x < 105 $$
tick

$$100 \leq x < 105 $$