Myths about teaching can hold you back
- Year 10
- Foundation
Checking understanding of bar charts and pictograms
I can construct/interpret bar charts and pictograms.
- Year 10
- Foundation
Checking understanding of bar charts and pictograms
I can construct/interpret bar charts and pictograms.
These resources were made for remote use during the pandemic, not classroom teaching.
Switch to our new teaching resources now - designed by teachers and leading subject experts, and tested in classrooms.
Lesson details
Key learning points
- Certain data is suitable for a pictogram or bar chart.
- The shape of the graph can be estimated from the data.
- For larger data sets, technology can make constructing graphs quicker.
Keywords
Bar chart - A bar chart (bar graph) is a graph consisting of bars visually representing the frequency of objects or groups.
Pictogram - A pictogram (pictograph) is a graph consisting of pictures to visually represent the frequency of objects or groups.
Common misconception
Pupils may miss the key in a pictogram, or the axes labels on a bar chart.
Pupils could be provided with a success criteria list, which they get in a habit of checking after constructing pictograms and bar charts.
To help you plan your year 10 maths lesson on: Checking understanding of bar charts and pictograms, download all teaching resources for free and adapt to suit your pupils' needs...
To help you plan your year 10 maths lesson on: Checking understanding of bar charts and pictograms, download all teaching resources for free and adapt to suit your pupils' needs.
The starter quiz will activate and check your pupils' prior knowledge, with versions available both with and without answers in PDF format.
We use learning cycles to break down learning into key concepts or ideas linked to the learning outcome. Each learning cycle features explanations with checks for understanding and practice tasks with feedback. All of this is found in our slide decks, ready for you to download and edit. The practice tasks are also available as printable worksheets and some lessons have additional materials with extra material you might need for teaching the lesson.
The assessment exit quiz will test your pupils' understanding of the key learning points.
Our video is a tool for planning, showing how other teachers might teach the lesson, offering helpful tips, modelled explanations and inspiration for your own delivery in the classroom. Plus, you can set it as homework or revision for pupils and keep their learning on track by sharing an online pupil version of this lesson.
Explore more key stage 4 maths lessons from the Comparisons of numerical summaries of data unit, dive into the full secondary maths curriculum, or learn more about lesson planning.

Licence
Prior knowledge starter quiz
6 Questions
Q1.Izzy has three boxes. Each box contains 37 items. Altogether Izzy has items.
Q2.A multipack of crisps contains 14 packets. Jacob needs a total of 56 packets of crisps for the year 7 disco. Jacob should buy multipacks.
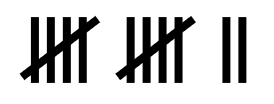
Q3.Which of these tally marks shows a frequency of 7?



Q4.The missing number on this scale is .

Q5.Two numbers are missing on this scale. What is the scale increasing by?

Q6.The is the number of times an event occurs; or the number of individuals (people, animals etc.) with some specific property.
Assessment exit quiz
6 Questions
Q1.The key elements of a pictogram are:
Q2.The key elements of a bar chart are:
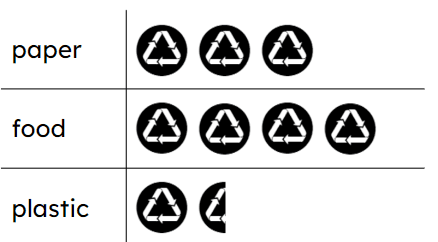
Q3.Each icon is worth 20 tonnes of recycling. The pictogram shows that tonnes of plastic were recycled.
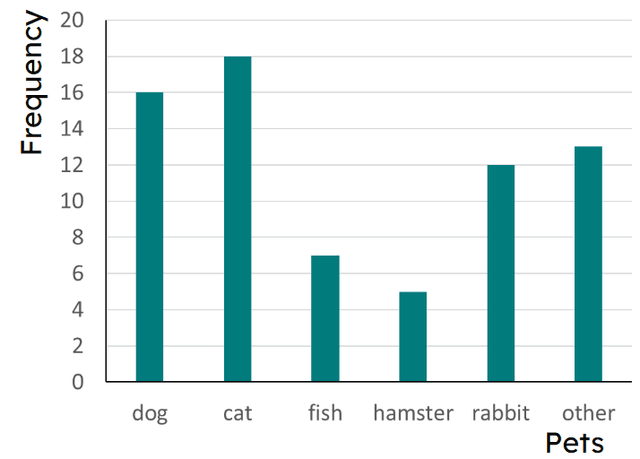
Q4.A vet records the number of each type of pet that they saw in one week in their surgery. The bar chart shows their results. The bar chart represents pets in total.
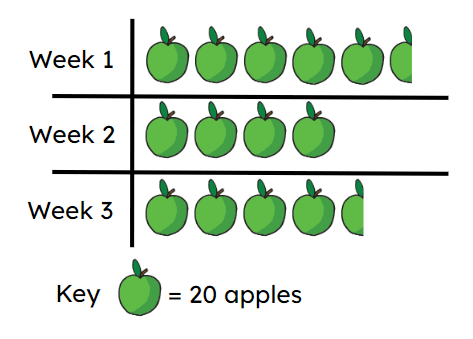
Q5.The pictogram shows the number of apples picked in an orchard over a three week period. Which of the following statements are correct?
Q6.Which of the following statements are correct about the data represented on this bar chart?
