Myths about teaching can hold you back

- Year 10
- Foundation
Checking understanding of summary statistics from a list
I can calculate the mean, median, mode and range from a list of data.
- Year 10
- Foundation
Checking understanding of summary statistics from a list
I can calculate the mean, median, mode and range from a list of data.
Lesson details
Key learning points
- The mean, median and mode are measures of central tendency.
- The range is a measure of the spread of the data.
- Calculating these from a list is easy when the data set is small.
Keywords
A statistical summary - sums up the features of a data set. It may contain the average (mean, median and/or mode) which measures the central tendency. It may also contain the range which measures the spread.
Common misconception
Pupils may forget to order the data to support finding the median, mode and range.
Use small data (ordered and unordered) to find the range and the median based on position. Race to find range and median of a longer list with one "team" ordering first and the other team not. Ordering can help with speed, accuracy and give insight.
To help you plan your year 10 maths lesson on: Checking understanding of summary statistics from a list, download all teaching resources for free and adapt to suit your pupils' needs...
To help you plan your year 10 maths lesson on: Checking understanding of summary statistics from a list, download all teaching resources for free and adapt to suit your pupils' needs.
The starter quiz will activate and check your pupils' prior knowledge, with versions available both with and without answers in PDF format.
We use learning cycles to break down learning into key concepts or ideas linked to the learning outcome. Each learning cycle features explanations with checks for understanding and practice tasks with feedback. All of this is found in our slide decks, ready for you to download and edit. The practice tasks are also available as printable worksheets and some lessons have additional materials with extra material you might need for teaching the lesson.
The assessment exit quiz will test your pupils' understanding of the key learning points.
Our video is a tool for planning, showing how other teachers might teach the lesson, offering helpful tips, modelled explanations and inspiration for your own delivery in the classroom. Plus, you can set it as homework or revision for pupils and keep their learning on track by sharing an online pupil version of this lesson.
Explore more key stage 4 maths lessons from the Comparisons of numerical summaries of data unit, dive into the full secondary maths curriculum, or learn more about lesson planning.

Licence
Lesson video
Loading...
Prior knowledge starter quiz
6 Questions
Q1.Starting with the smallest, put these numbers in ascending order.
Q2.Starting with the smallest, put these decimals in ascending order.
Q3.The sum is the total when numbers are together.
Q4.The sum of 23, 36 and 41 is .
Q5.The number that is exactly halfway between 23 and 30 is .
Q6.8 is 9 away from 17 and also 9 away from .
Assessment exit quiz
6 Questions
Q1.Which of these data sets has the greatest range?
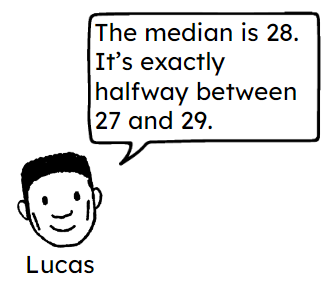
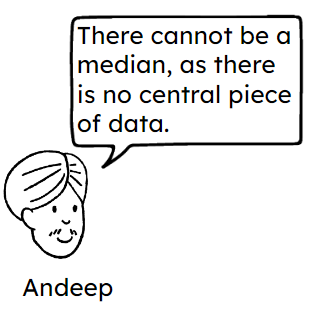
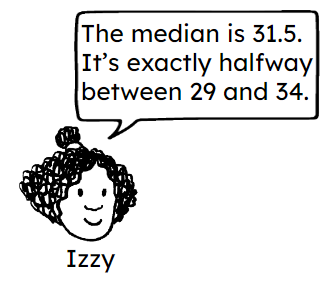
Q2.Who is correct about the median of this data set: 34, 27, 29, 41?
Q3.The mean for the data set 2.3, 5.6, 7.4, 3.6, 8.1 is .
Q4.Which of these data sets have a mean of 6?
Q5.Match each number of values and mean to the correct total.
total of the values is 48
total of the values is 60
total of the values is 16
total of the values is 540