Comparing data sets in context
I can use measures of central tendency and spread to compare two data sets in context.
Comparing data sets in context
I can use measures of central tendency and spread to compare two data sets in context.
These resources will be removed by end of Summer Term 2025.
Switch to our new teaching resources now - designed by teachers and leading subject experts, and tested in classrooms.
These resources were created for remote use during the pandemic and are not designed for classroom teaching.
Lesson details
Key learning points
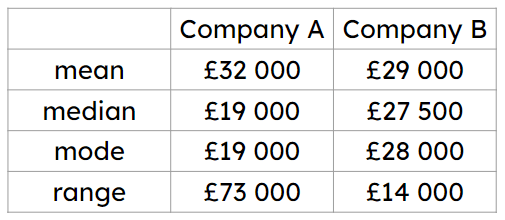
- Data can be hard to compare when presented in lists and tables.
- Statistical summaries can be calculated to compare data sets.
- Statistical summaries do not always provide enough information by themselves.
Keywords
A statistical summary - sums up the features of a data set. It may contain the average (mean, median and/or mode) which measures the central tendency. It may also contain the range which measures the spread.
Common misconception
Pupils may feel that one statistical summary is enough to compare two data sets.
Highlight to pupils that the more information you know, the better your understanding of a data set and therefore a more comprehensive comparison can take place. Compare the means of {-120, -100, -50, 0, 1000} and {145, 145, 146, 147, 147}.
To help you plan your year 10 maths lesson on: Comparing data sets in context, download all teaching resources for free and adapt to suit your pupils' needs...
To help you plan your year 10 maths lesson on: Comparing data sets in context, download all teaching resources for free and adapt to suit your pupils' needs.
The starter quiz will activate and check your pupils' prior knowledge, with versions available both with and without answers in PDF format.
We use learning cycles to break down learning into key concepts or ideas linked to the learning outcome. Each learning cycle features explanations with checks for understanding and practice tasks with feedback. All of this is found in our slide decks, ready for you to download and edit. The practice tasks are also available as printable worksheets and some lessons have additional materials with extra material you might need for teaching the lesson.
The assessment exit quiz will test your pupils' understanding of the key learning points.
Our video is a tool for planning, showing how other teachers might teach the lesson, offering helpful tips, modelled explanations and inspiration for your own delivery in the classroom. Plus, you can set it as homework or revision for pupils and keep their learning on track by sharing an online pupil version of this lesson.
Explore more key stage 4 maths lessons from the Comparisons of numerical summaries of data unit, dive into the full secondary maths curriculum, or learn more about lesson planning.

Licence
Lesson video
Loading...
Prior knowledge starter quiz
6 Questions
Assessment exit quiz
6 Questions