Myths about teaching can hold you back


- Year 11•
- Foundation


- Year 11•
- Foundation
Frequency trees
I can draw and use a frequency tree to calculate probabilities.
These resources were made for remote use during the pandemic, not classroom teaching.
Switch to our new teaching resources now - designed by teachers and leading subject experts, and tested in classrooms.
Lesson details
Key learning points
- There are key differences between frequency trees and probability trees
- Frequency trees are constructed using frequencies
- Frequency trees display information on how often an outcome happened within a set number of trials
Keywords
Frequency - The frequency is the number of times an event occurs; or the number of individuals (people, animals etc.) with some specific property.
Tree diagram - Tree diagrams are a representation used to model statistical/probability questions. Branches represent different possible events or outcomes.
Probability - The probability that an event will occur is the proportion of times the event is expected to happen in a suitably large experiment.
Common misconception
Pupils may be tempted to always use the total frequency from a tree as the denominator of any fraction.
The denominator of the fraction should be the total frequency of the group that is being selected from. This could be the total population or it could be a subgroup of the population.
To help you plan your year 11 maths lesson on: Frequency trees, download all teaching resources for free and adapt to suit your pupils' needs...
To help you plan your year 11 maths lesson on: Frequency trees, download all teaching resources for free and adapt to suit your pupils' needs.
The starter quiz will activate and check your pupils' prior knowledge, with versions available both with and without answers in PDF format.
We use learning cycles to break down learning into key concepts or ideas linked to the learning outcome. Each learning cycle features explanations with checks for understanding and practice tasks with feedback. All of this is found in our slide decks, ready for you to download and edit. The practice tasks are also available as printable worksheets and some lessons have additional materials with extra material you might need for teaching the lesson.
The assessment exit quiz will test your pupils' understanding of the key learning points.
Our video is a tool for planning, showing how other teachers might teach the lesson, offering helpful tips, modelled explanations and inspiration for your own delivery in the classroom. Plus, you can set it as homework or revision for pupils and keep their learning on track by sharing an online pupil version of this lesson.
Explore more key stage 4 maths lessons from the Conditional probability unit, dive into the full secondary maths curriculum, or learn more about lesson planning.

Licence
Prior knowledge starter quiz
6 Questions
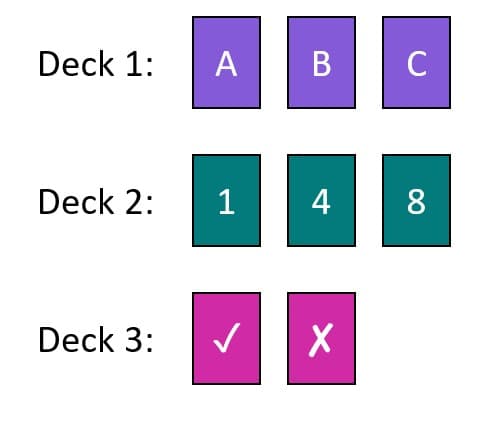
Q1.Here are three decks of cards.
A single card from each of Deck 1, Deck 2, and Deck 3 is drawn to make a trio.
What is the probability that this trio of cards contains an even number?
Q2.Sam plays a video game that can either be won or lost.
The probability that Sam wins the video game is $$8\over15$$.
What is the probability that Sam loses the video game?
Q3.This table shows the mutually exclusive and exhaustive set of outcomes, and the probability of each outcome, from spinning a spinner once.
Find the value of $$x$$.

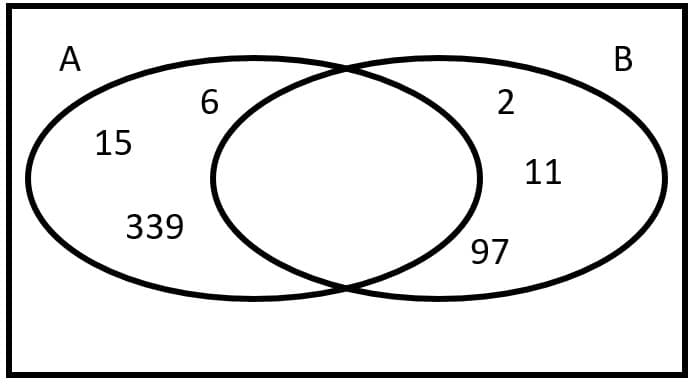
Q4.Each card in a deck of 7 cards has a unique integer on it. The Venn diagram shows events A = {multiples of 3} & B = {prime numbers}.
A and B are not mutually exclusive. Find the number on the 7th card
Q5.A game can be won by either Alex, Sam, or Jacob.
By constructing and solving an algebraic equation, find P(Sam wins).

Q6.A spinner with outcomes {A, B, C, D} is spun once.
P(A) = 0.15.
P(B) = $$x$$.
P(C) is three times as likely as P(B).
P(D) is equally likely as P(A or C).
P(B) = . Give your answer as a decimal.
Assessment exit quiz
6 Questions
Q1.1000 people were surveyed to see if they either commute to work, or work from home, and whether they use a computer or not. How many people work from home but don’t use a computer?
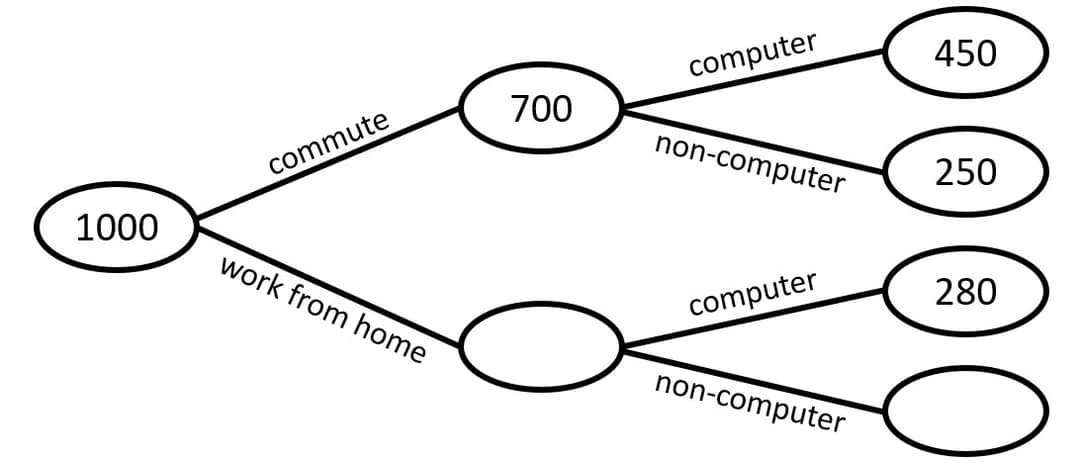
Q2.1000 people were surveyed to see if they either commute to work, or work from home, and whether they use a computer or not.
What fraction of people who work from home use a computer?

Q3.1000 people were surveyed to see if they either commute to work, or work from home, and whether they use a computer or not.
What fraction of people who use a computer work from home?

Q4.Match each frequency from the frequency tree to its value.
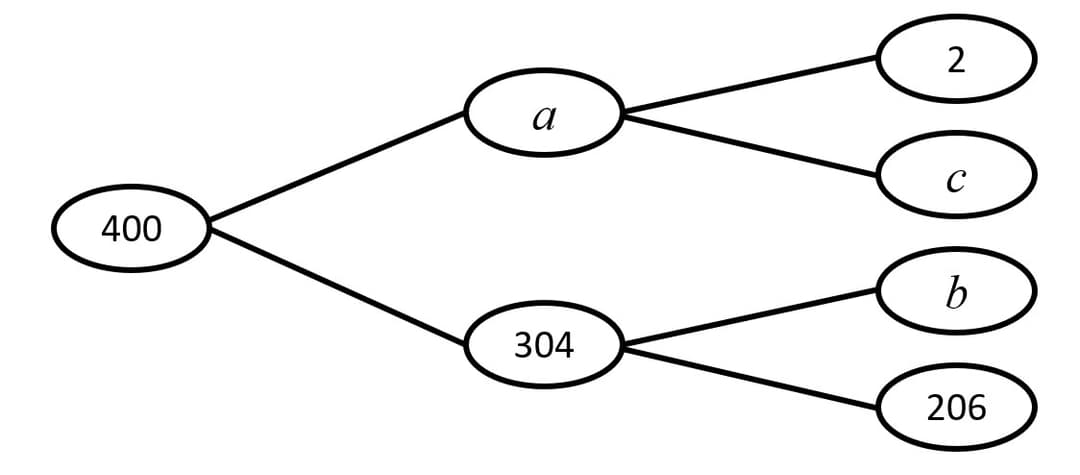
$$a$$ -
96
$$b$$ -
98
$$c$$ -
94
total frequency -
400
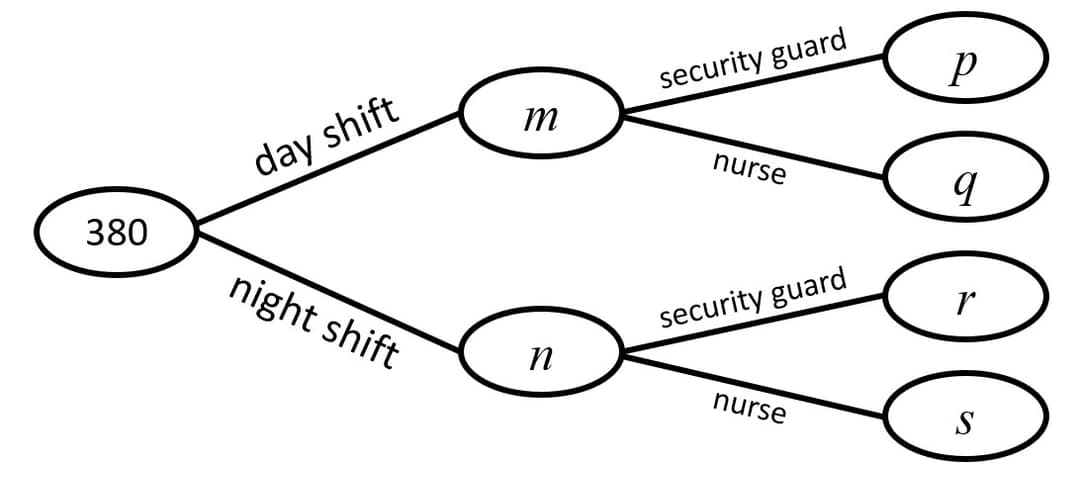
Q5.Of the 180 people who are day shift workers, 30 are security guards.
There are a total of 70 security guards. Match each frequency from the frequency tree to its value.
$$n$$ -
200
$$p$$ -
30
$$q$$ -
150
$$r$$ -
40
$$s$$ -
160
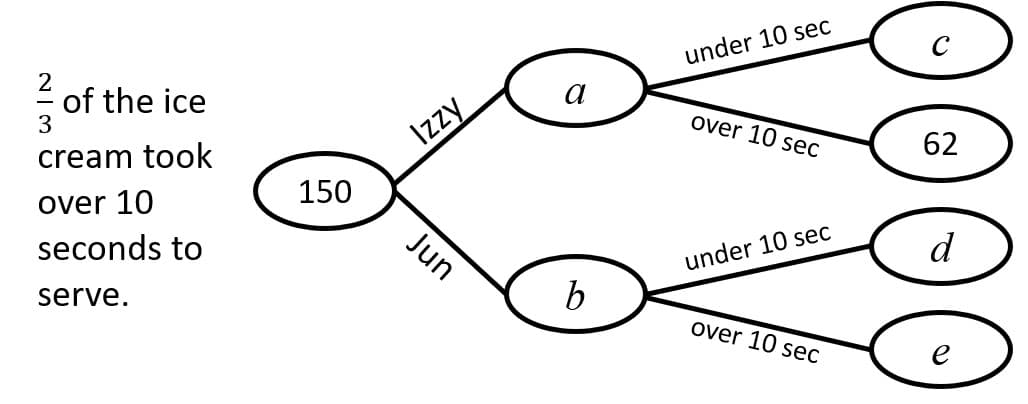
Q6.Jun and Izzy raised money for charity by selling ice cream. Izzy sold 60% of the ice cream, whilst Jun sold the rest.
Match each frequency from the frequency tree to its value.
$$a$$ -
90
$$b$$ -
60
$$c$$ -
28
$$d$$ -
22
$$e$$ -
38

