icon-background-square
New
New
Year 10
Foundation

Problem solving with non-linear graphs

I can use my knowledge of non-linear graphs to solve problems.

icon-background-square
New
New
Year 10
Foundation

Problem solving with non-linear graphs

I can use my knowledge of non-linear graphs to solve problems.

warning

These resources will be removed by end of Summer Term 2025.

Switch to our new teaching resources now - designed by teachers and leading subject experts, and tested in classrooms.

Lesson details

Key learning points

  1. The shape of the graph can be used to identify the form of its equation.
  2. If the graph has a context, then the solutions should be given in context.

Keywords

  • Linear - The relationship between two variables is linear if, when plotted on a pair of axes, a straight line is formed.

  • Quadratic - A quadratic is an equation, graph, or sequence whereby the highest exponent of the variable is 2

  • Cubic - A cubic is an equation, graph, or sequence whereby the highest exponent of the variable is 3

Common misconception

A graph drawn on axes with no scale shown means nothing is known about the graph.

Understanding the shape of a parabola, cubic curve, and reciprocal graph and then applying key features like positive/negative coefficients and $$y$$-intercepts enables pupils to infer much about the equation without needing actual coordinate values.

Ask pupils to verbalise their reasoning when matching graphs to equations. "How do you 'know' that is the graph of... ?" is a key question to ask once pupils have matched a pair. Being able to justify with technical vocabulary is a powerful skill in mathematics.
speech-bubble
Teacher tip
copyright

Licence

This content is © Oak National Academy Limited (2024), licensed on

except where otherwise stated. See Oak's terms & conditions (Collection 2).

Lesson video

Loading...

6 Questions

Q1.
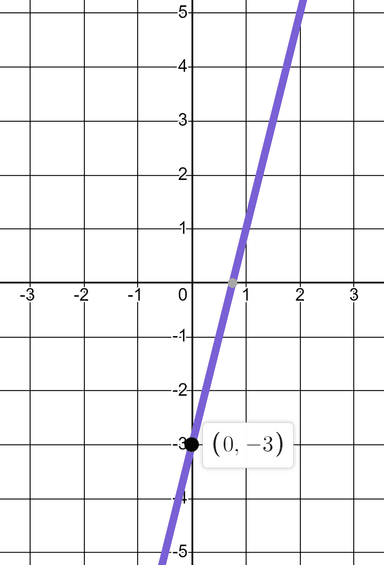
For this linear graph $$y=4x-3$$, the coordinates (0, -3) is the __________.
An image in a quiz
Correct answer: $$y$$-intercept
$$y$$-intersection
$$y$$-axis
Q2.
$$y=4x-3$$ is a linear equation which therefore forms a __________ graph.
An image in a quiz
curved
gradient
Correct answer: linear
parabolic
Q3.
Izzy plots the graph of $$y=x^2$$. When the $$x$$ coordinate is $$-4$$, the $$y$$ coordinate is .
Correct Answer: 16, y=16, y = 16
Q4.
Jacob plots the graph of $$y=x^3$$. When the $$x$$ coordinate is $$-2$$, the $$y$$ coordinate is .
Correct Answer: -8, y=-8, y = -8
Q5.
Sofia plots the reciprocal graph $$y={1\over{x}}$$. Which of these will be coordinate pairs?
Correct answer: $$(2,{1\over2})$$
$$(1,-1)$$
$$(-1,1)$$
Correct answer: $$(-1,-1)$$
$$(-{1\over2},2)$$
Q6.
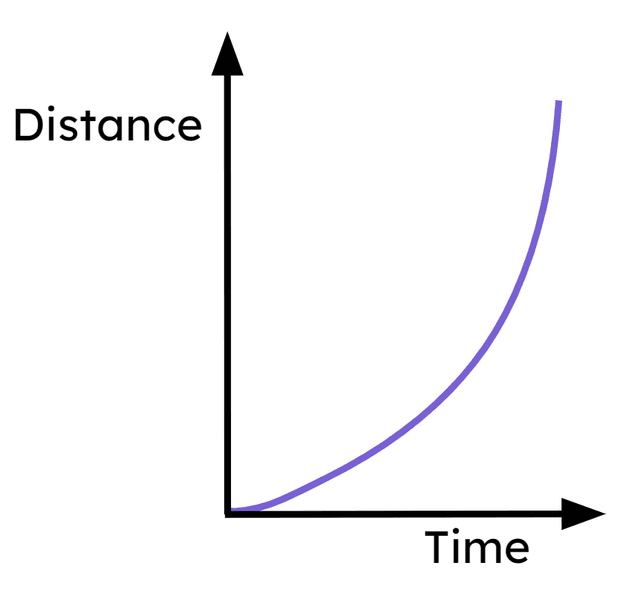
This graph represents __________ of distance with respect to time.
An image in a quiz
Correct answer: an increasing rate of change
a decreasing rate of change
a constant rate of change

6 Questions

Q1.
The graph of $$y=x^3+2$$ will form a __________.
Correct answer: cubic curve
linear graph
parabola
reciprocal graph
Q2.
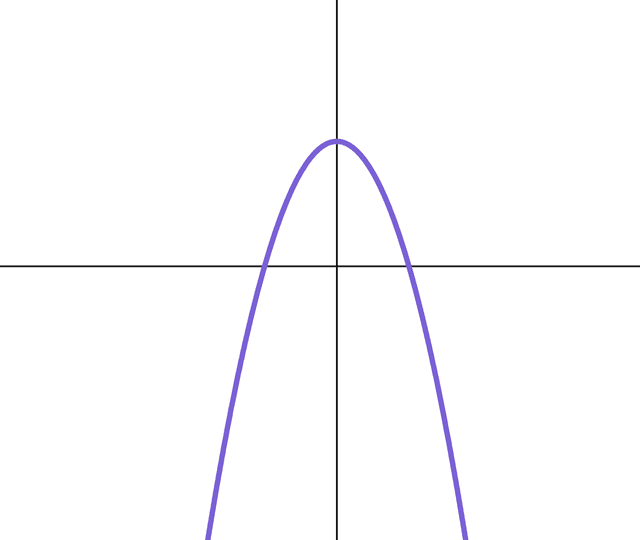
Which of these could be the equation of this graph?
An image in a quiz
Correct answer: $$-x^2+3$$
$$x^2+3$$
$$-x^2-3$$
$$x^2-3$$
$$x^3+3$$
Q3.
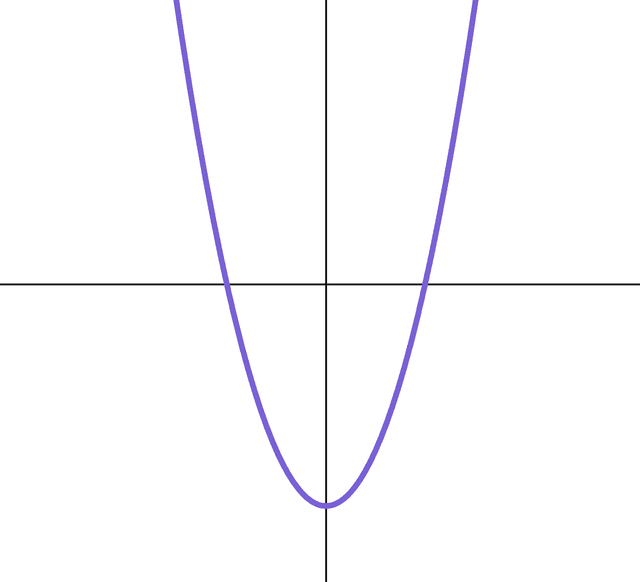
Which of these could be the equation of this graph?
An image in a quiz
Correct answer: $$x^2-5$$
$$x^2+5$$
$$-x^2+5$$
$$-x^2-5$$
$$2x-5$$
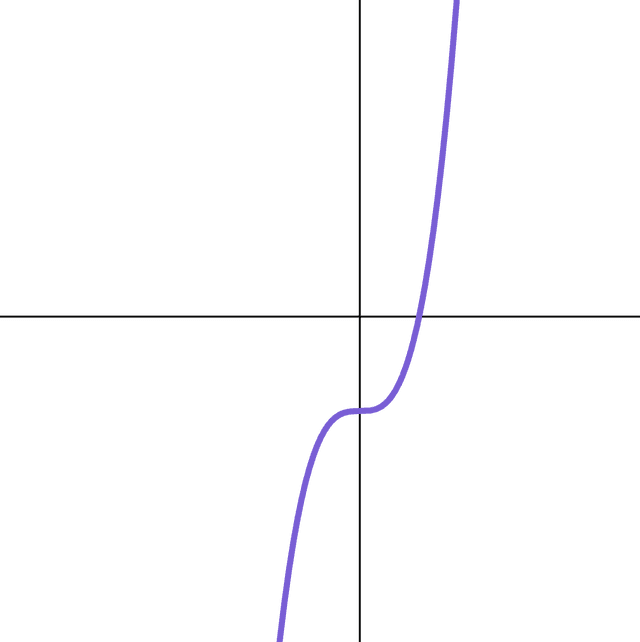
Q4.
Which of these could be the equation of this graph?
An image in a quiz
$$y=x^3$$
$$y=-x^3$$
Correct answer: $$y=x^3-2$$
$$y=x^3+2$$
$$y=x^2-3$$
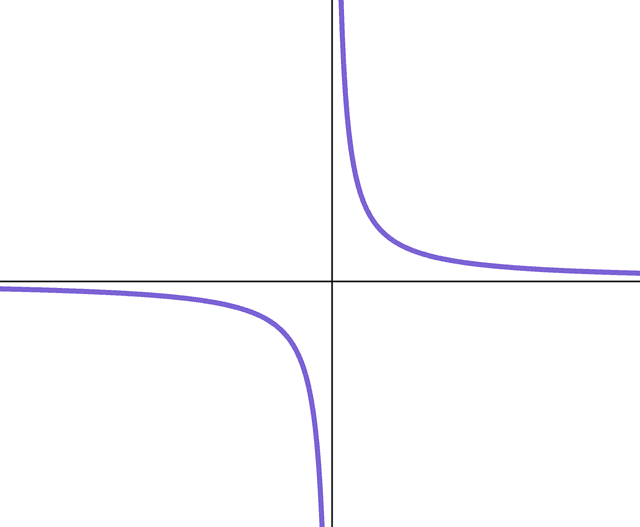
Q5.
Which of these equations could this graph represent?
An image in a quiz
Correct answer: $$y={5\over{x}}$$
$$y={-5\over{x}}$$
$$y=x^3$$
Correct answer: $$y={3\over{x}}$$
$$y={-3\over{x}}$$
Q6.
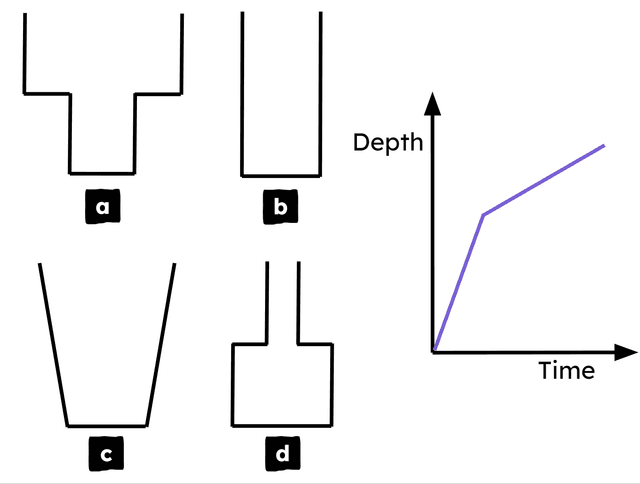
Given that water is added at a steady rate which vase would generate this Depth-Time graph?
An image in a quiz
Correct answer: a
b
c
d