New
New
Year 11
Foundation

Distance-time graphs

I can calculate time intervals and speed of sections of a distance-time graph.

New
New
Year 11
Foundation

Distance-time graphs

I can calculate time intervals and speed of sections of a distance-time graph.

Lesson details

Key learning points

  1. On a distance-time graph, a horizontal line means no distance was travelled for that time.
  2. A slanted line means that the distance from the start is changing over time.
  3. The distance travelled divided by the time taken gives the speed.
  4. You find this by considering the change in distance with respect to the change in time.
  5. This is how you find the gradient of the line, which is also the speed.

Common misconception

Not looking at units when calculating the gradient of the line to find speed.

A recap on compound measures and units may be helpful here. The units of compound measures tell us how to calculate the measure. E.g. km/h is the distance in km/ time in hours. Pupils need to check the units on their graphs and convert if needed.

Keywords

  • Gradient - The gradient is a measure of how steep a line is. It is calculated by finding the rate of change in the $$y$$-direction with respect to the positive $$x$$-direction.

  • Displacement - Displacement is the distance from the starting point when measured in a straight line.

This is a good opportunity to show the links between different methods to calculate speed. Pupils may have used the formula before and/or used ratio tables. By calculating the gradient it is possible to show the equivalence of these two methods.
Teacher tip

Licence

This content is © Oak National Academy Limited (2024), licensed on Open Government Licence version 3.0 except where otherwise stated. See Oak's terms & conditions (Collection 2).

Loading...

6 Questions

Q1.
What number is the arrow pointing to on this number line?
An image in a quiz
Correct Answer: 12.4
Q2.
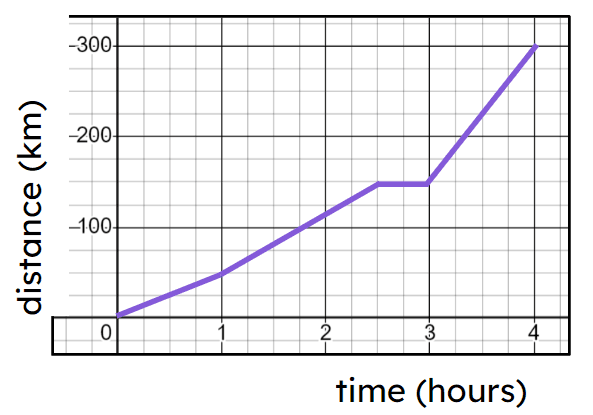
Here is a distance-time graph for a journey. How far had been travelled after 1 hour?
An image in a quiz
Correct Answer: 50 km, 50km, 50 kilometres
Q3.
Here is a distance-time graph for a journey. How far had been travelled after 3 hours?
An image in a quiz
Correct Answer: 150 km, 150km, 150 kilometres
Q4.
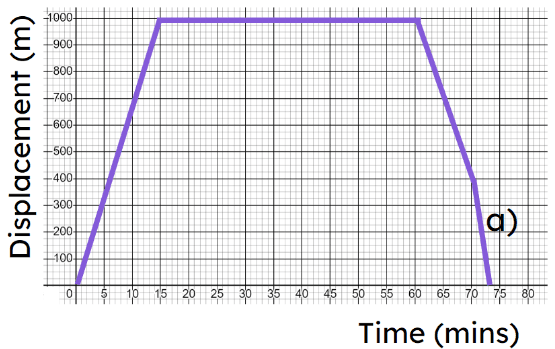
On this displacement-time graph what does the line segment marked a) represent?
An image in a quiz
Moving away from the fixed start point at a constant speed.
Correct answer: Moving towards the fixed start point at a constant speed.
Object is decelerating.
Object is stationary.
Object is travelling down hill.
Q5.
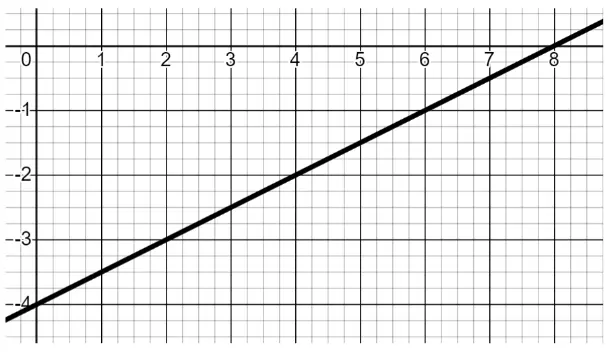
What is the gradient of this line?
An image in a quiz
-2
-0.5
Correct answer: 0.5
1
2
Q6.
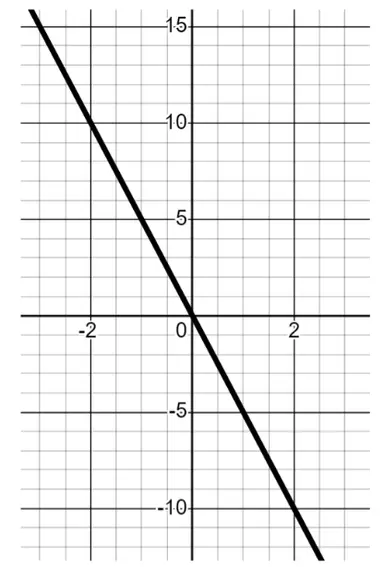
The gradient of this line is .
An image in a quiz
Correct Answer: -5

6 Questions

Q1.
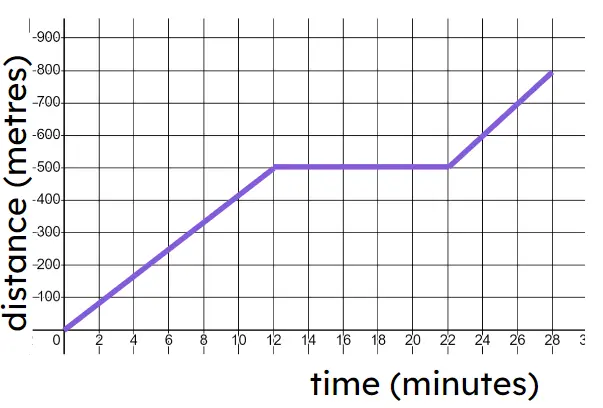
This is a distance-time graph for a journey. What was the total distance travelled?
An image in a quiz
Correct Answer: 800 m, 800m, 800 metres
Q2.
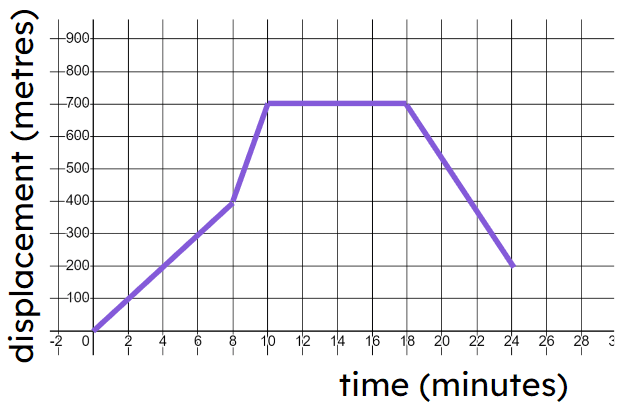
This is a displacement-time graph for a journey. How far was travelled in total?
An image in a quiz
Correct Answer: 1200 m, 1.2 km, 1200 metres, 1.2 kilometres
Q3.
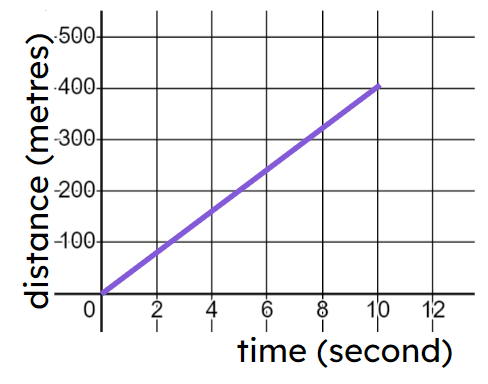
Here is a distance-time graph for a race car driving on a straight track. How fast is the car going?
An image in a quiz
0.025 m/s
0.8 m/s
Correct answer: 40 m/s
50 m/s
400 m/s
Q4.
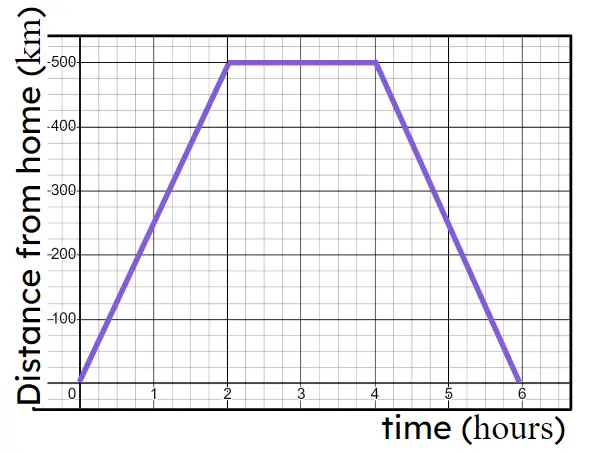
What speed is the object travelling at between 4 and 6 hours? Give your answer in km/h.
An image in a quiz
Correct Answer: 250 km/h
Q5.
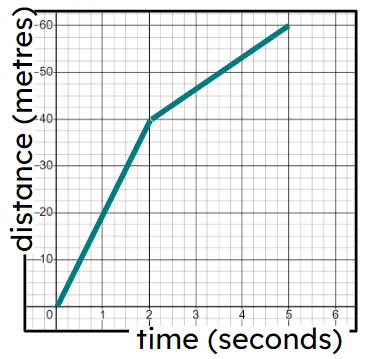
The distance-time graph shows a two stage journey of an object. What is the average speed of this object?
An image in a quiz
Correct Answer: 12 m/s, 12 metres per second
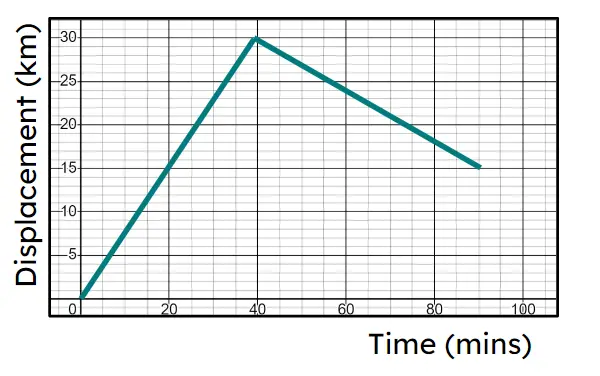
Q6.
The average speed for this journey is km/h.
An image in a quiz
Correct Answer: 30, 30 km/h