Myths about teaching can hold you back

- Year 10•
- Foundation
Checking understanding of statistical problems
I can evaluate different statistical measures to draw conclusions about a data set.
- Year 10•
- Foundation
Checking understanding of statistical problems
I can evaluate different statistical measures to draw conclusions about a data set.
Lesson details
Key learning points
- A statistical summary involves the mean, median, mode and range.
- Each summary gives us different insights into a data set.
- Conclusions may be affected by the way the data was collected.
Keywords
Arithmetic mean - The (arithmetic) mean for a set of numerical data is the sum of the values divided by the number of values. It is a measure of central tendency representing the average of the values.
Median - The median is the central (middle) piece of data when the data are in numerical order. It is a measure of central tendency representing the average of the values.
Mode - The mode is the most frequent value. It is a measure of central tendency representing the average of the values.
Range - The range is a measure of spread. It is found by finding the difference between the highest and lowest values.
Population - The population is the entire set of people, creatures, plants or items that make up the whole group which is being studied.
Common misconception
Pupils may believe that as mean, median and mode are all averages that they are all as useful as each other for every data set.
Using non qualitative data to show that the mean and median cannot be calculated, so the mode would be the only option. Showing data sets that have the same mean value but are considerably different to each other.
To help you plan your year 10 maths lesson on: Checking understanding of statistical problems, download all teaching resources for free and adapt to suit your pupils' needs...
To help you plan your year 10 maths lesson on: Checking understanding of statistical problems, download all teaching resources for free and adapt to suit your pupils' needs.
The starter quiz will activate and check your pupils' prior knowledge, with versions available both with and without answers in PDF format.
We use learning cycles to break down learning into key concepts or ideas linked to the learning outcome. Each learning cycle features explanations with checks for understanding and practice tasks with feedback. All of this is found in our slide decks, ready for you to download and edit. The practice tasks are also available as printable worksheets and some lessons have additional materials with extra material you might need for teaching the lesson.
The assessment exit quiz will test your pupils' understanding of the key learning points.
Our video is a tool for planning, showing how other teachers might teach the lesson, offering helpful tips, modelled explanations and inspiration for your own delivery in the classroom. Plus, you can set it as homework or revision for pupils and keep their learning on track by sharing an online pupil version of this lesson.
Explore more key stage 4 maths lessons from the Sampling unit, dive into the full secondary maths curriculum, or learn more about lesson planning.

Licence
Lesson video
Loading...
Prior knowledge starter quiz
6 Questions
Q1.Match each summary statistic to its definition.
Mode -
Most common data value
Median -
The middle (central) piece of data when the data are in order
Mean -
Sum of the data values divided by the number of values
Range -
Highest data value − lowest data value
Q2.Sam collects data on how many sweets are in 9 different packs. The results are 13, 12, 11, 9, 8, 8, 10, 8, 11. The modal number of sweets is .
Q3.Sam collects data on how many sweets are in 9 different packs. The results are 13, 12, 11, 9, 8, 8, 10, 8, 11. The median number of sweets is .
Q4.Sam collects data on how many sweets are in 9 different packs. The results are 13, 12, 11, 9, 8, 8, 10, 8, 11. The mean number of sweets is .
Q5.Sam collects data on how many sweets are in 9 different packs. The results are 13, 12, 11, 9, 8, 8, 10, 8, 11. The range in the number of sweets is .
Q6.This set of data has two values missing. $$\square$$, 5, 6, 7, 8, $$\square$$, 5, 6, 8. The mean of the data is 6, the mode is 5 and the median is 6. Select the missing data values.
Assessment exit quiz
6 Questions
Q1.Select all the types of average.
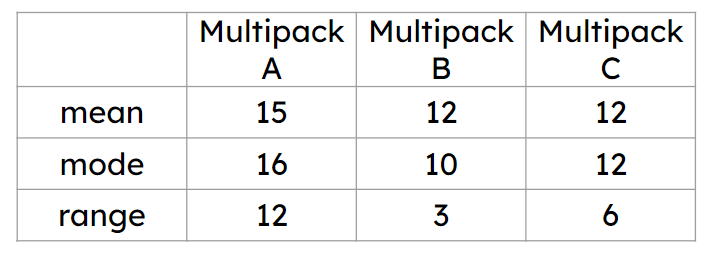
Q2.Data has been collected and processed about the number of sweets per packet in 3 different multipacks. The company claims ‘an average of 12 sweets per pack’. Which multipack best supports the claim?
Q3.Izzy and Jun compare their scores in their last 10 maths tests. The tables show the summary statistics. Select the statements that are correct about their mean scores.
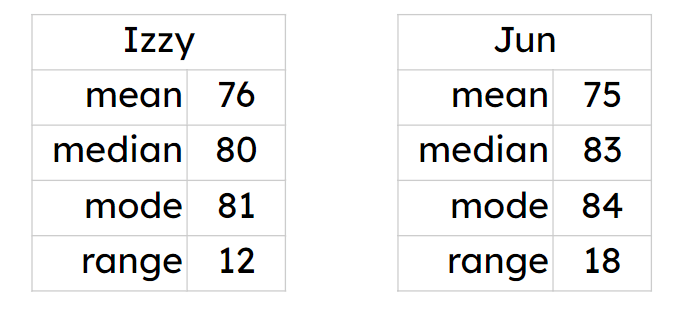
Q4.Izzy and Jun compare their scores in their last 10 maths tests. The tables show the summary statistics. Select the statement that is correct about their median scores.
Q5.Jacob went to the library and surveyed 10 adults in the library to find out how many books they read in a month. The mean was 2 books. Jacob says, "All adults read 2 books a month." Is he correct?
Q6.The table of summary statistics shows the number of days of air frost each day in December over the last 10 years. Select the correct statements.