Myths about teaching can hold you back

- Year 10
- Foundation
The Statistical Enquiry Cycle
I can understand the stages of the Statistical Enquiry Cycle.
- Year 10
- Foundation
The Statistical Enquiry Cycle
I can understand the stages of the Statistical Enquiry Cycle.
Lesson details
Key learning points
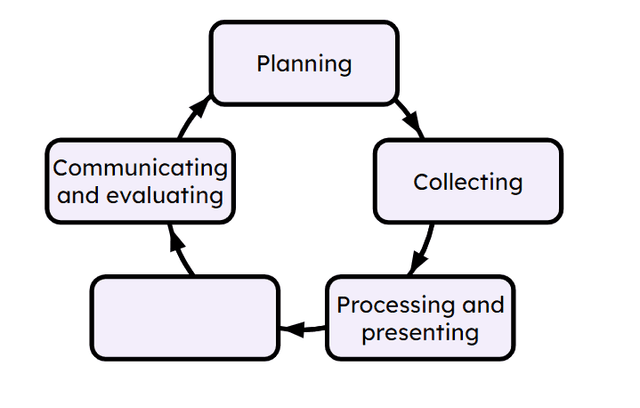
- Planning involves defining a question to investigate and what data to collect.
- Collecting involves designing collection methods.
- Processing and presenting involves calculating statistical measures and graphical representations.
- Interpreting involves reaching conclusions and making inferences.
- Communicating and evaluating involves identifying weaknesses and improvements.
Keywords
Statistical Enquiry Cycle - The Statistical Enquiry Cycle is a cycle used to carry out a statistical investigation. There are five stages. This is an ongoing process as evaluation may lead to new/refined questioning.
Common misconception
Pupils may reach false conclusions by not following the Statistical Enquiry Cycle and skipping stages.
Ask pupils to consider trying to draw conclusions from a large data set of raw values, where no processing or representation has taken place, to highlight the need for that stage in particular.
To help you plan your year 10 maths lesson on: The Statistical Enquiry Cycle, download all teaching resources for free and adapt to suit your pupils' needs...
To help you plan your year 10 maths lesson on: The Statistical Enquiry Cycle, download all teaching resources for free and adapt to suit your pupils' needs.
The starter quiz will activate and check your pupils' prior knowledge, with versions available both with and without answers in PDF format.
We use learning cycles to break down learning into key concepts or ideas linked to the learning outcome. Each learning cycle features explanations with checks for understanding and practice tasks with feedback. All of this is found in our slide decks, ready for you to download and edit. The practice tasks are also available as printable worksheets and some lessons have additional materials with extra material you might need for teaching the lesson.
The assessment exit quiz will test your pupils' understanding of the key learning points.
Our video is a tool for planning, showing how other teachers might teach the lesson, offering helpful tips, modelled explanations and inspiration for your own delivery in the classroom. Plus, you can set it as homework or revision for pupils and keep their learning on track by sharing an online pupil version of this lesson.
Explore more key stage 4 maths lessons from the Sampling unit, dive into the full secondary maths curriculum, or learn more about lesson planning.

Licence
Lesson video
Loading...
Prior knowledge starter quiz
6 Questions
Q1.Select all the measures of spread.
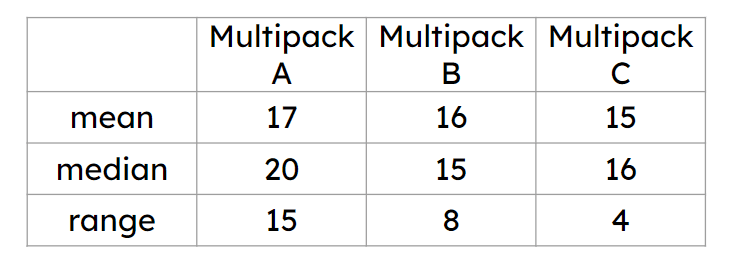
Q2.Data has been collected and processed about the number of sweets per packet in 3 different multipacks. The company claims ‘an average of 15 sweets per pack’. Which multipack best supports the claim?
Q3.Izzy and Jun compare their scores in their last 10 maths tests. The tables show the summary statistics. Select the statements that are correct about the mode of their scores.
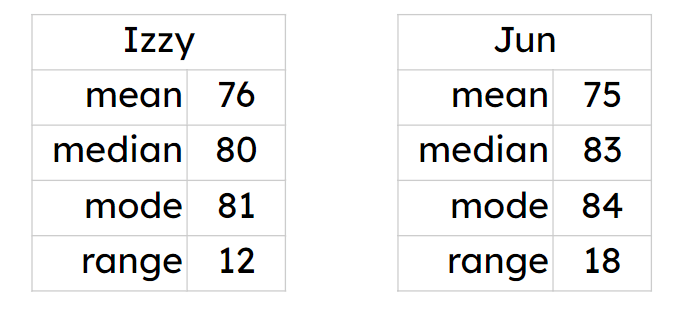
Q4.Izzy and Jun compare their scores in their last 10 maths tests. The tables show the summary statistics. Select the statements that are correct about the range of their scores.
Q5.Jacob went to the gym and surveyed 10 adults in the gym to find out how much exercise they do a week. The mean was 5 hours. Jacob says, "All adults exercise for 5 hours a week." Is he correct?
Q6.The table of summary statistics shows the number of days of air frost each day in December over the last 10 years. Select the correct statements.
Assessment exit quiz
6 Questions
Q1.Put the stages of the Statistical Enquiry Cycle in order. Start with the stage that should come first when you first begin a statistical enquiry.
Q2.Sofia is conducting a survey to find out how often people visit the gym. Which stage of the Statistical Enquiry Cycle does this event fit in?
Q3.Match each stage of the Statistical Enquiry Cycle to an event.
Deciding to research the safety of driverless cars
Testing a driverless car on a track
Using a spreadsheet to analyse the data
Looking at results and deciding what they show
Concluding a new driverless car is safe
Q4.Which stage is missing from this Statistical Enquiry Cycle?