Myths about teaching can hold you back

- Year 10•
- Higher
Calculating summary statistics from a grouped frequency table
I can calculate the median, mode and range from a grouped frequency table.
- Year 10•
- Higher
Calculating summary statistics from a grouped frequency table
I can calculate the median, mode and range from a grouped frequency table.
Lesson details
Key learning points
- The median and mode are measures of central tendency.
- The range is a measure of the spread of the data.
- Calculating these from a grouped frequency table may be easier when the data set is very large.
Keywords
Interval - An interval is all the values between two points.
Modal class - The modal class is the interval, or group of values, with the highest frequency in a data set.
Median class - The median class is the class which contains the central (middle) datum when the data are in numerical order.
Common misconception
That the interval widths need to be constant, or conversely that they can be anything.
If interested in people's ages it may be that decades makes sense once over 30 but that significant ages such as 16, 18 and 21 should form boundaries, depending on context. Encourage critical thinking for data with unequal intervals.
To help you plan your year 10 maths lesson on: Calculating summary statistics from a grouped frequency table, download all teaching resources for free and adapt to suit your pupils' needs...
To help you plan your year 10 maths lesson on: Calculating summary statistics from a grouped frequency table, download all teaching resources for free and adapt to suit your pupils' needs.
The starter quiz will activate and check your pupils' prior knowledge, with versions available both with and without answers in PDF format.
We use learning cycles to break down learning into key concepts or ideas linked to the learning outcome. Each learning cycle features explanations with checks for understanding and practice tasks with feedback. All of this is found in our slide decks, ready for you to download and edit. The practice tasks are also available as printable worksheets and some lessons have additional materials with extra material you might need for teaching the lesson.
The assessment exit quiz will test your pupils' understanding of the key learning points.
Our video is a tool for planning, showing how other teachers might teach the lesson, offering helpful tips, modelled explanations and inspiration for your own delivery in the classroom. Plus, you can set it as homework or revision for pupils and keep their learning on track by sharing an online pupil version of this lesson.
Explore more key stage 4 maths lessons from the Comparisons of numerical summaries of data unit, dive into the full secondary maths curriculum, or learn more about lesson planning.

Licence
Lesson video
Loading...
Prior knowledge starter quiz
6 Questions
Q1.Which of these describes the mode of a data set.
Q2.Match each summary statistic to its value for the data set: 2, 2, 2, 4, 7, 19
mean -
6
median -
3
mode -
2
range -
17
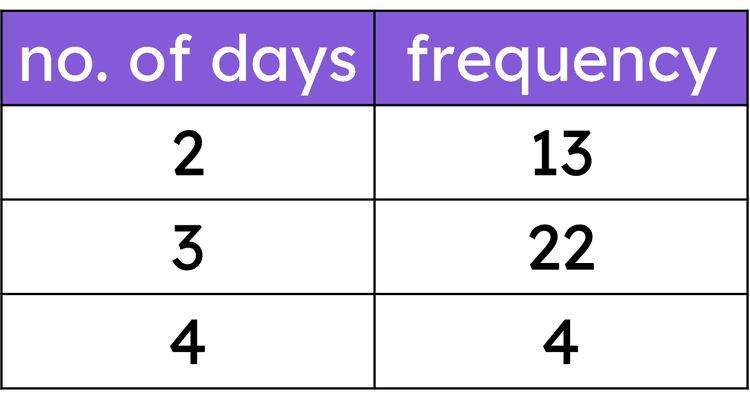
Q3.Which of these statements are correct for this data set shown in a frequency table?
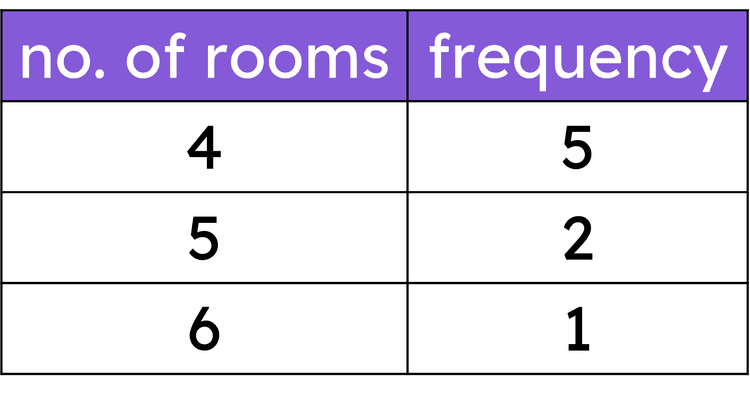
Q4.The table shows the number of rooms in some flats in a block of flats. The mean number of rooms in this data set is rooms.
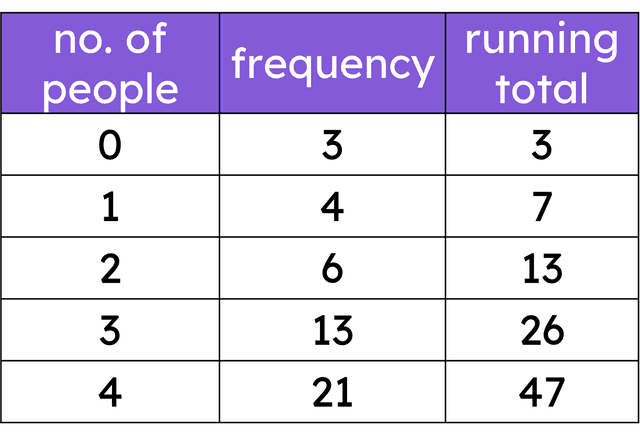
Q5.The median number of people in this data set is people.
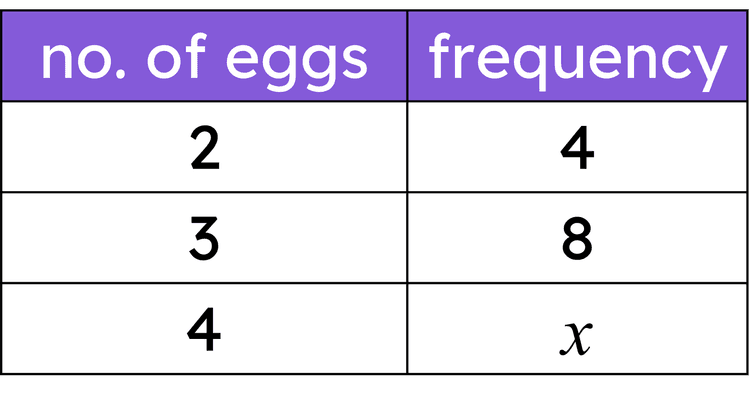
Q6.Chocolate eggs are sold in boxes of either 2, 3, or 4. The number of boxes with each number of eggs is recorded. The mean of this data set is 3.5 eggs. The value of $$x$$ is .
Assessment exit quiz
6 Questions
Q1.Match each phrase to its definition.
modal class -
the interval with the highest frequency in a data set
median class -
the interval which contains the central datum in an ordered data set
mode -
the most frequent data value in a data set
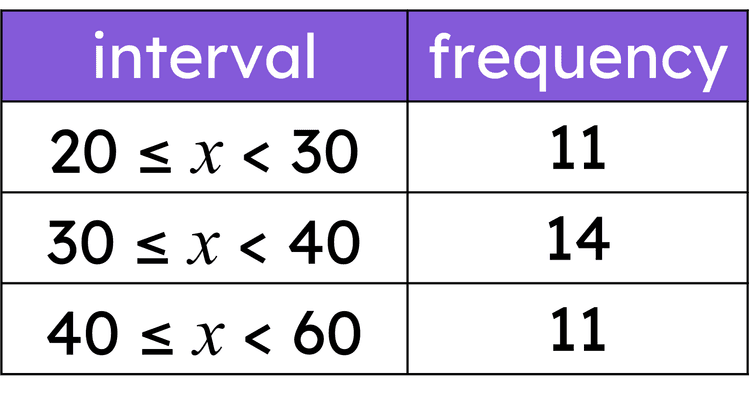
Q2.What is the modal class of this data set?
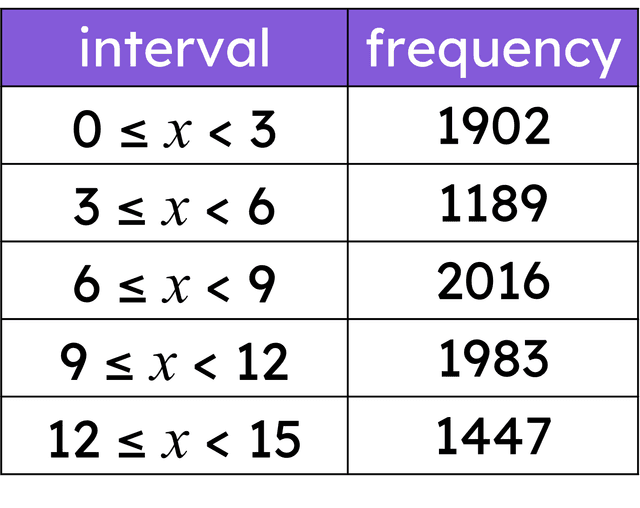
Q3.This data set only contains integers. Which of these could be data points in the modal class?
Q4.The maximum possible range of this data set is .
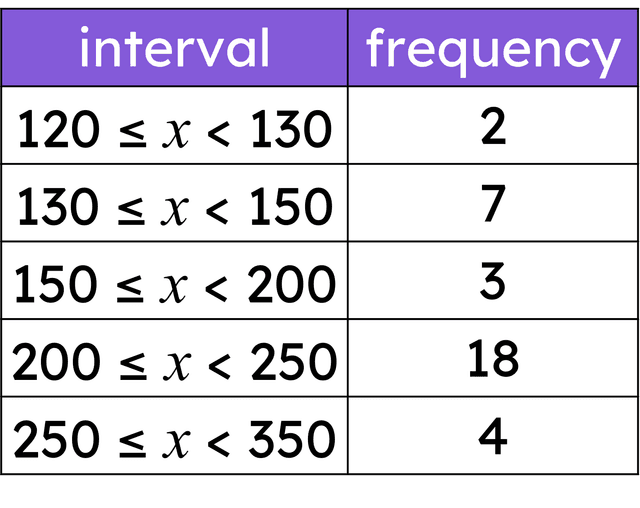
Q5.The average expected range of this data set is .
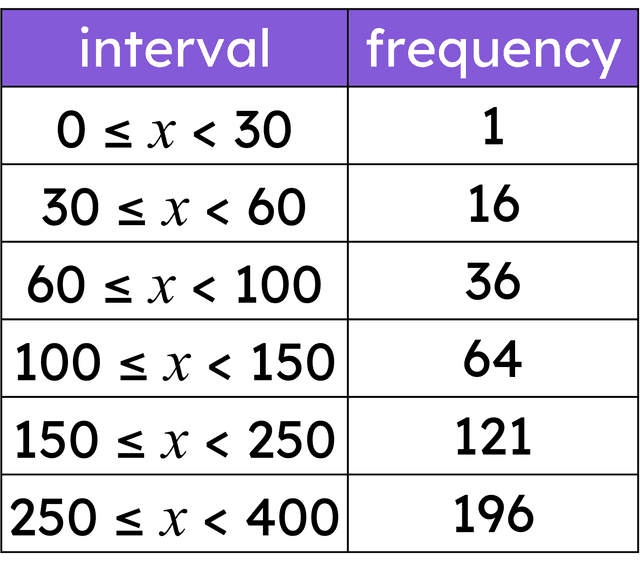
Q6.Match each piece of information to its value.
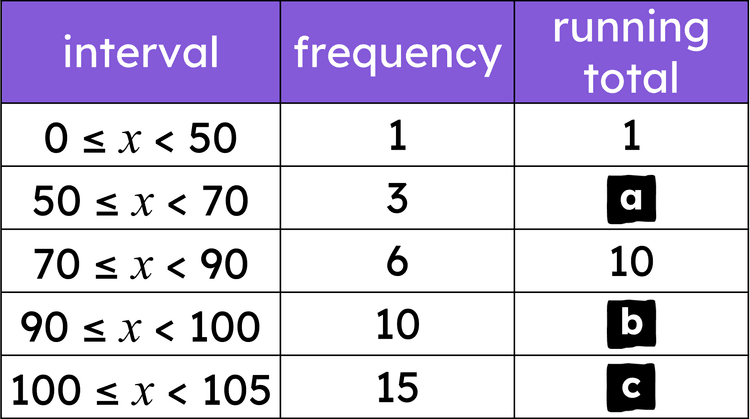
a -
4
b -
20
c -
35
median class -
$$90 \leq x < 100 $$
modal class -
$$100 \leq x < 105 $$