Myths about teaching can hold you back

- Year 10
- Higher
Calculating summary statistics from stem and leaf diagrams
I can calculate the mean, median, mode and range from a stem and leaf diagram.
- Year 10
- Higher
Calculating summary statistics from stem and leaf diagrams
I can calculate the mean, median, mode and range from a stem and leaf diagram.
Lesson details
Key learning points
- The range can be calculated from a stem and leaf diagram.
- The mode can be calculated from a stem and leaf diagram.
- The median can be calculated from a stem and leaf diagram.
- Although possible, the mean is very time consuming to calculate.
Keywords
Stem and leaf diagram - A stem and leaf diagram is a systematic way to organise and represent numerical data, by splitting each value into a stem and a leaf.
Mean - The (arithmetic) mean for a set of numerical data is the sum of the values divided by the number of values. It is a measure of central tendency representing the average of the values.
Median - The median is the central (middle) piece of data when the data are in numerical order.
Mode - Mode is the most frequent value. It is a measure of central tendency representing the average of the values.
Range - The range is a measure of spread. It is found by finding the difference between the two extreme points; the lowest and highest values.
Common misconception
You can only find the median class from a stem-and-leaf diagram.
The data is organised into intervals based on place value. However the full data is still available so the middle value(s) can still be found. The diagram is a form of an ordered list so previous methods for finding the median still apply.
To help you plan your year 10 maths lesson on: Calculating summary statistics from stem and leaf diagrams, download all teaching resources for free and adapt to suit your pupils' needs...
To help you plan your year 10 maths lesson on: Calculating summary statistics from stem and leaf diagrams, download all teaching resources for free and adapt to suit your pupils' needs.
The starter quiz will activate and check your pupils' prior knowledge, with versions available both with and without answers in PDF format.
We use learning cycles to break down learning into key concepts or ideas linked to the learning outcome. Each learning cycle features explanations with checks for understanding and practice tasks with feedback. All of this is found in our slide decks, ready for you to download and edit. The practice tasks are also available as printable worksheets and some lessons have additional materials with extra material you might need for teaching the lesson.
The assessment exit quiz will test your pupils' understanding of the key learning points.
Our video is a tool for planning, showing how other teachers might teach the lesson, offering helpful tips, modelled explanations and inspiration for your own delivery in the classroom. Plus, you can set it as homework or revision for pupils and keep their learning on track by sharing an online pupil version of this lesson.
Explore more key stage 4 maths lessons from the Comparisons of numerical summaries of data unit, dive into the full secondary maths curriculum, or learn more about lesson planning.

Licence
Lesson video
Loading...
Prior knowledge starter quiz
6 Questions
Q1.A statistical summary sums up the features of a data set. It may contain an which measures the central tendency. It may also contain the range which measures the spread.
Q2.The mode of this data set is .
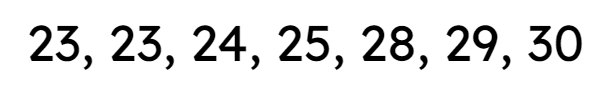
Q3.The range of this data set is .
Q4.The median of this data set is .
Q5.The mean of this this data set is .
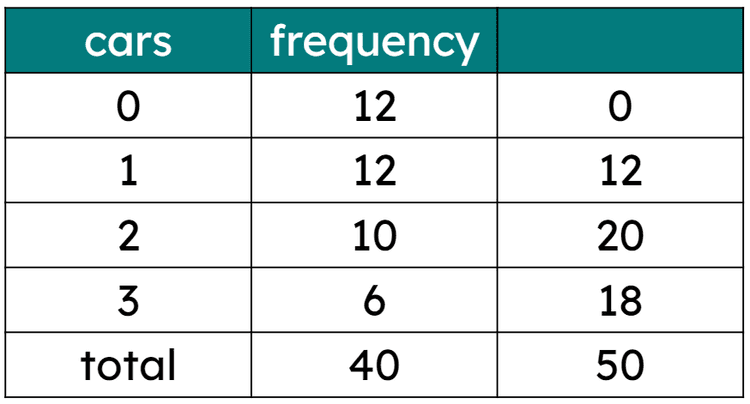
Q6.This table represents the number of cars in 40 households. The mean number of cars per household is cars.
Assessment exit quiz
6 Questions
Q1.The modal group in this stem and leaf diagram is __________.
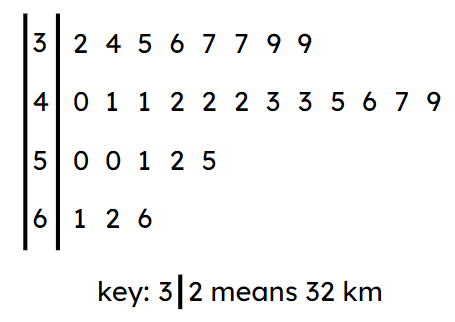
Q2.The modal distance is km.
Q3.The range of the data shown on this stem and leaf diagram is km.
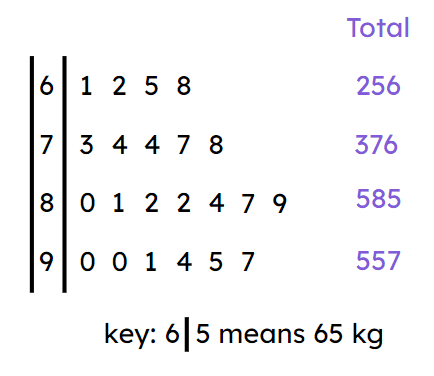
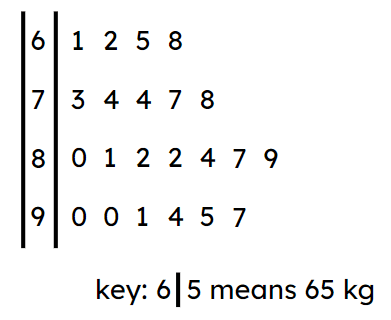
Q4.The total of the first row of leaves is kg.
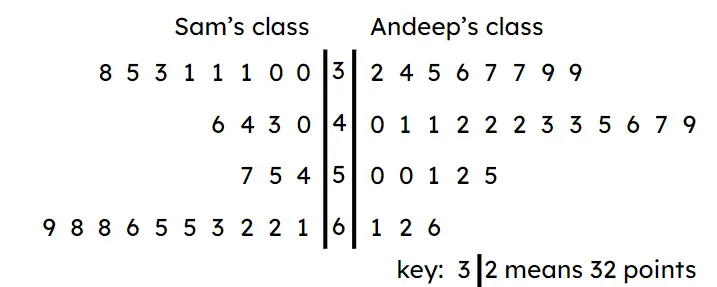
Q5.Sam and Andeep draw a back-to-back stem and leaf diagram to compare their classes' scores in a quiz. Match the summary statistic for each class with its value.
39
31
54
34
42
42.5
Q6.Calculate the mean mass (to 2 decimal places) of the data represented in this stem and leaf diagram. The totals for each row have been calculated already.