New
New
Year 10
Higher
Checking understanding composite and bar-line charts
I can construct/interpret composite bar charts and bar-line charts.
New
New
Year 10
Higher
Checking understanding composite and bar-line charts
I can construct/interpret composite bar charts and bar-line charts.
Lesson details
Key learning points
- Certain data is suitable for a composite bar chart or bar-line chart.
- The shape of the graph can be estimated from the data.
- For larger data sets, technology can make constructing graphs quicker.
Common misconception
Pupils may read the frequency or % proportion value off of the y-axis for each group on a composite bar chart.
Remind pupils that another name for composite bar charts is a stacked bar chart and the frequency needs to be calculated.
Keywords
Bar chart - A bar chart (bar graph) is a graph consisting of bars visually representing the frequency of objects or groups.
If you have access to coloured mulitlink cubes, pupils can construct a composite bar chart by stacking the cubes for data they collect. You can then ask them to convert it into a comparison bar chart.
Teacher tip
Licence
This content is © Oak National Academy Limited (2024), licensed on Open Government Licence version 3.0 except where otherwise stated. See Oak's terms & conditions (Collection 2).
Video
Loading...
Starter quiz
Download starter quiz
6 Questions
Q1.
True or false? Pictograms can use any icon.
True. Any icon can be used to represent a given value.
True. The icons are sized differently to represent different values.
False. Icons should never be used.
Q2.
Bar charts should have gaps when displaying __________ or __________ data.
continuous
Q3.
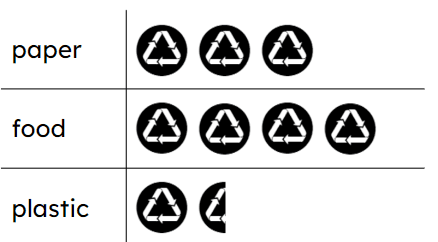
Each icon is worth 6 tonnes of recycling. The pictogram shows that tonnes of plastic were recycled.
Q4.
A vet records the number of each type of pet that they saw in one week in their surgery. The bar chart shows their results. What percentage of the pets seen were fish?
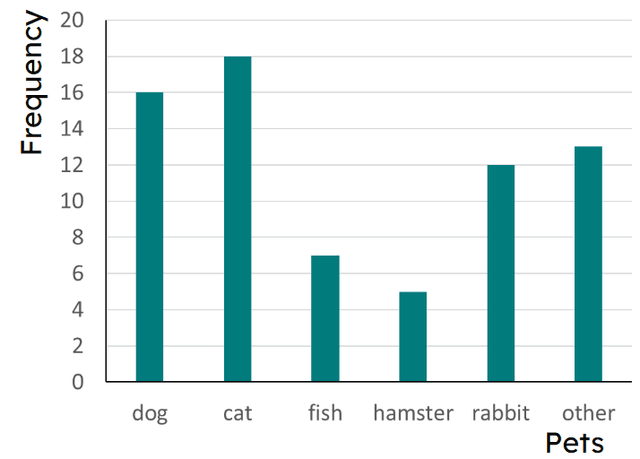
7.0
16.9
18.3
Q5.
The pictogram shows the number of apples picked in an orchard over a three week period. Which of the following statements are correct?
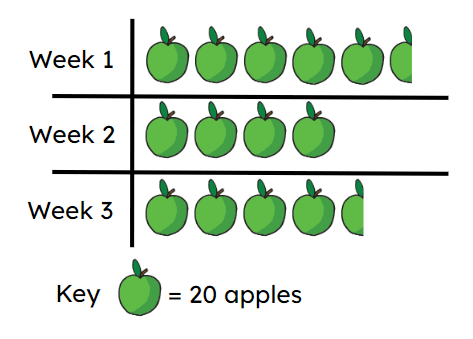
A total of 14 apples were picked in the three week period.
20 fewer apples were picked in week 1 than in week 3.
Q6.
Which of the following statements are correct about the data represented on this bar chart?
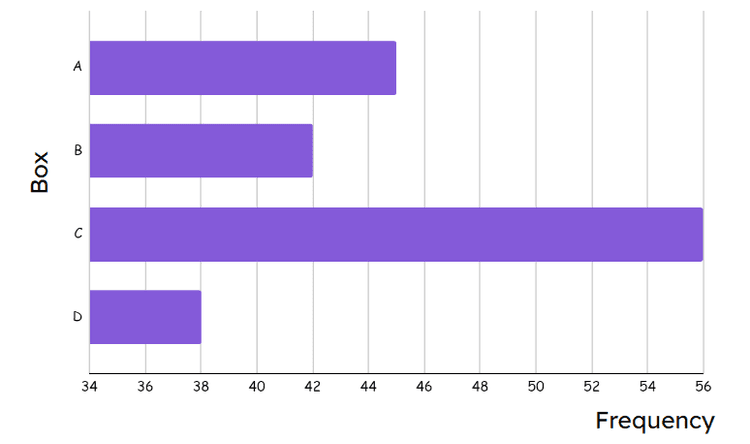
Box D had half as many items as box B.
There were 171 items across the four boxes.
Exit quiz
Download exit quiz
6 Questions
Q1.
Select the charts which are examples of bar or bar-line charts.


Q2.
What is the most popular genre of book?
Detective
Sci-fi
Q3.
This composite bar chart shows the ice-cream sales for two different parlours. How many vanilla flavoured (V) ice creams were sold in parlour 1?

15
20
36
Q4.
This composite bar chart shows the ice-cream sales for two different parlours. How many strawberry flavoured (S) ice creams were sold in parlour 2?
16
18
22
Q5.
This composite bar chart shows the ice-cream sales for two different parlours. What was the total number of chocolate flavoured (C) ice creams sold across both parlours?
45
15
36
Q6.
This composite bar chart shows the ice-cream sales for two different parlours. What is the difference in mint flavoured (M) ice cream sales between the two parlours?
2
3
6