New
New
Year 10
Higher

Checking understanding of bar charts and pictograms

I can construct/interpret bar charts and pictograms.

New
New
Year 10
Higher

Checking understanding of bar charts and pictograms

I can construct/interpret bar charts and pictograms.

Lesson details

Key learning points

  1. Certain data is suitable for a pictogram or bar chart.
  2. The shape of the graph can be estimated from the data.
  3. For larger data sets, technology can make constructing graphs quicker.

Common misconception

Pupils may miss the key in a pictogram, or the axes labels on a bar chart.

Pupils could be provided with a success criteria list, which they get in a habit of checking after constructing pictograms and bar charts.

Keywords

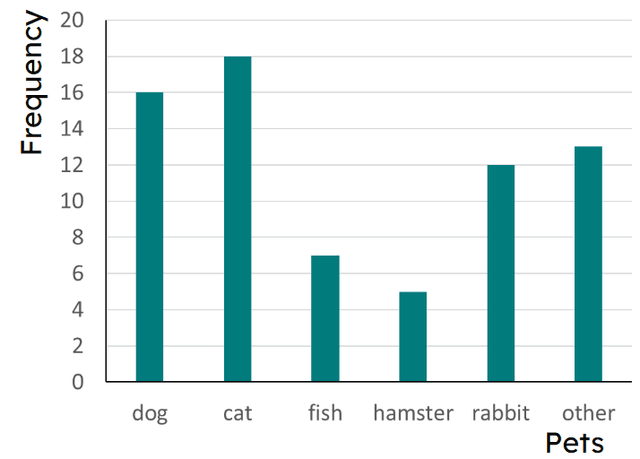
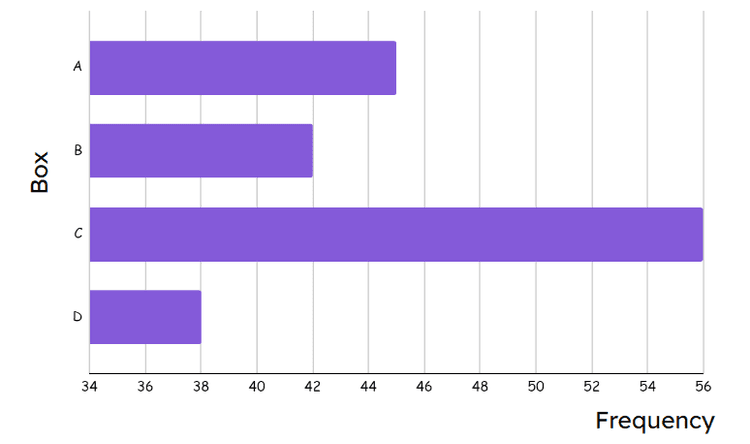
  • Bar chart - A bar chart (bar graph) is a graph consisting of bars visually representing the frequency of objects or groups.

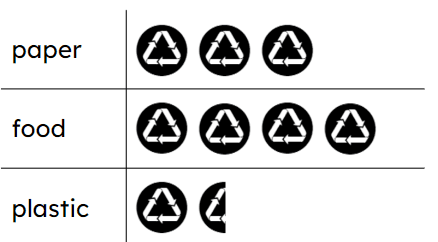
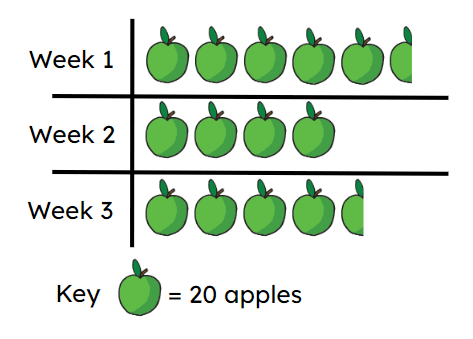
  • Pictogram - A pictogram (pictograph) is a graph consisting of pictures to visually represent the frequency of objects or groups.

Discuss with pupils, data that could be collected and easily represented on a pictogram and data that would be less easy to represent on a pictogram.
Teacher tip

Licence

This content is © Oak National Academy Limited (2024), licensed on Open Government Licence version 3.0 except where otherwise stated. See Oak's terms & conditions (Collection 2).

Loading...

6 Questions

Q1.
Izzy has three boxes. Each box contains 37 items. Altogether Izzy has items.
Correct Answer: 111, one hundred and eleven
Q2.
A multipack of crisps contains 14 packets. Jacob needs a total of 56 packets of crisps for the year 7 disco. Jacob should buy multipacks.
Correct Answer: 4, four
Q3.
Which of these tally marks shows a frequency of 7?
Correct Answer: An image in a quiz
An image in a quiz
An image in a quiz
An image in a quiz
An image in a quiz
Q4.
The missing number on this scale is .
An image in a quiz
Correct Answer: 17, seventeen
Q5.
Two numbers are missing on this scale. What is the scale increasing by?
An image in a quiz
Correct Answer: 4, four
Q6.
The is the number of times an event occurs; or the number of individuals (people, animals etc.) with some specific property.
Correct Answer: frequency

6 Questions

Q1.
The key elements of a pictogram are:
icons sized according to value
Correct answer: icons evenly spaced
Correct answer: key with a well chosen value
Correct answer: simple representative icon
commas between icons
Q2.
The key elements of a bar chart are:
Correct answer: labelled axes
no gaps between bars
Correct answer: scale increasing equally
uneven bar widths
colour
Q3.
Each icon is worth 20 tonnes of recycling. The pictogram shows that tonnes of plastic were recycled.
An image in a quiz
Correct Answer: 30, thirty
Q4.
A vet records the number of each type of pet that they saw in one week in their surgery. The bar chart shows their results. The bar chart represents pets in total.
An image in a quiz
Correct Answer: 71, seventy one
Q5.
The pictogram shows the number of apples picked in an orchard over a three week period. Which of the following statements are correct?
An image in a quiz
Correct answer: The most apples were picked in week 1.
More than half of the apples picked over the 3 weeks were picked in week 1.
A total of 14 apples were picked in the three week period.
10 more apples were picked in week 2 than week 3.
Correct answer: 20 more apples were picked in week 1 than in week 3.
Q6.
Which of the following statements are correct about the data represented on this bar chart?
An image in a quiz
Box B had the least number of items.
Box D had half as many items as box B.
Correct answer: Box A had 3 more items than box B.
Correct answer: There were 181 items across the four boxes.
Box C has twice as many items as box A.