New
New
Year 10
Higher
Checking understanding of summary statistics from a frequency table
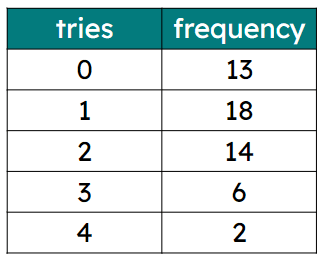
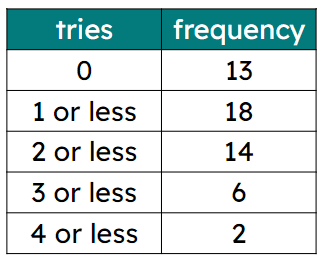
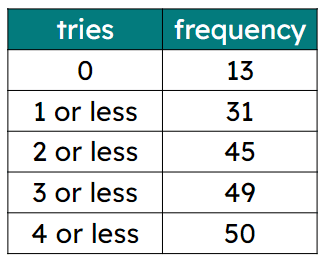
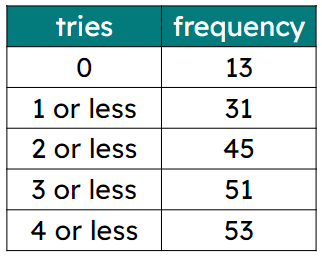
I can calculate the mean, median, mode and range from a frequency table.
New
New
Year 10
Higher
Checking understanding of summary statistics from a frequency table
I can calculate the mean, median, mode and range from a frequency table.
Link copied to clipboard
These resources will be removed by end of Summer Term 2025.
Switch to our new teaching resources now - designed by teachers and leading subject experts, and tested in classrooms.
These resources were created for remote use during the pandemic and are not designed for classroom teaching.
Lesson details

Lesson video
Loading...
Starter quiz
Download starter quiz
6 Questions

Exit quiz
Download exit quiz