Myths about teaching can hold you back


- Year 11•
- Higher
Checking and securing calculating probabilities from diagrams
I can calculate probabilities from probability trees and Venn diagrams.


- Year 11•
- Higher
Checking and securing calculating probabilities from diagrams
I can calculate probabilities from probability trees and Venn diagrams.
These resources were made for remote use during the pandemic, not classroom teaching.
Switch to our new teaching resources now - designed by teachers and leading subject experts, and tested in classrooms.
Lesson details
Key learning points
- The probability of an outcome can be found by considering a tree diagram
- The probability of an event can be found by considering a tree diagram
- The probability of an outcome can be found by considering a Venn diagram
- The probability of an event can be found by considering a Venn diagram
Keywords
Probability - The probability that an event will occur is the proportion of times the event is expected to happen in a suitably large experiment.
Frequency - The frequency is the number of times an event occurs; or the number of individuals (people, animals etc.) with some specific property.
Exhaustive events - A set of events are exhaustive if at least one of them has to occur whenever the experiment is carried out.
Mutually exclusive - Two or more events are are mutually exclusive if they share no common outcome.
Common misconception
Pupils may add the probabilities along branches of a probability tree, rather than multiplying them.
Remind pupils that probabilities cannot be greater than 1 and demonstrate that adding across the branches sometimes results in a probability that is greater than 1. Therefore, it must be wrong.
To help you plan your year 11 maths lesson on: Checking and securing calculating probabilities from diagrams, download all teaching resources for free and adapt to suit your pupils' needs...
To help you plan your year 11 maths lesson on: Checking and securing calculating probabilities from diagrams, download all teaching resources for free and adapt to suit your pupils' needs.
The starter quiz will activate and check your pupils' prior knowledge, with versions available both with and without answers in PDF format.
We use learning cycles to break down learning into key concepts or ideas linked to the learning outcome. Each learning cycle features explanations with checks for understanding and practice tasks with feedback. All of this is found in our slide decks, ready for you to download and edit. The practice tasks are also available as printable worksheets and some lessons have additional materials with extra material you might need for teaching the lesson.
The assessment exit quiz will test your pupils' understanding of the key learning points.
Our video is a tool for planning, showing how other teachers might teach the lesson, offering helpful tips, modelled explanations and inspiration for your own delivery in the classroom. Plus, you can set it as homework or revision for pupils and keep their learning on track by sharing an online pupil version of this lesson.
Explore more key stage 4 maths lessons from the Conditional probability unit, dive into the full secondary maths curriculum, or learn more about lesson planning.

Licence
Prior knowledge starter quiz
6 Questions
Q1.Students were asked whether they walked to school or used other transport methods, and how long their journey took them. Find the probability a student had a journey of 15 minutes or under.

Q2.A spinner with outcomes {1, 2, 3, 5, 9, 15} is spun twice. The outcome of each spin is added together.
Find P(multiple of 5).
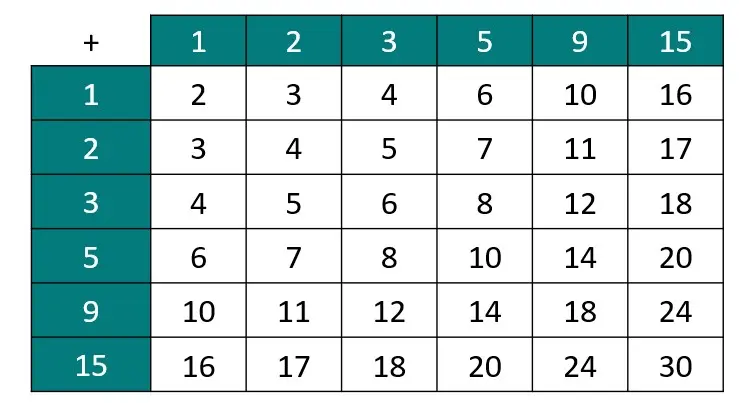
Q3.A spinner with outcomes {1, 2, 3, 5, 9, 15} is spun twice. The outcome of each spin is added together.
Find P(prime number).

Q4.People at a bus station were surveyed their age and where their destination was.
Match each frequency from the table to its value.

$$a$$ -
141
$$b$$ -
84
$$c$$ -
80
$$d$$ -
40
$$e$$ -
190
$$f$$ -
210
Q5.People at a bus station were surveyed their age and where their destination was.
A person is chosen at random.
Find P(under 60 and going to Oakfield).

Q6.People at a bus station were surveyed their age and where their destination was.
A person going to Rowanwood is chosen at random.
Find P(60 or over).

Assessment exit quiz
6 Questions
Q1.A set of events are if at least one of them has to occur whenever the experiment is carried out.
Q2.A survey asked people whether they lived in Oakfield or not, and if they last shopped by online delivery or by going in-store. A random person is selected. Match each event to its probability.
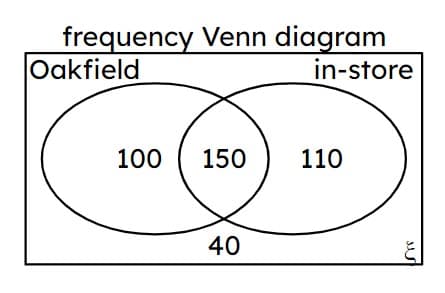
P(lives in Oakfield) -
$$250\over400$$
P(doesn't live in Oakfield) -
$$150\over400$$
P(shops in-store) -
$$260\over400$$
P(shops online) -
$$140\over400$$
P(lives in Oakfield and shops online) -
$$100\over400$$
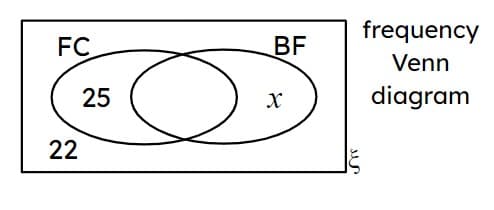
Q3.A swimming club has 80 members. There are 13 members who swim both front crawl (FC) and butterfly (BF). The value of $$x$$ is .
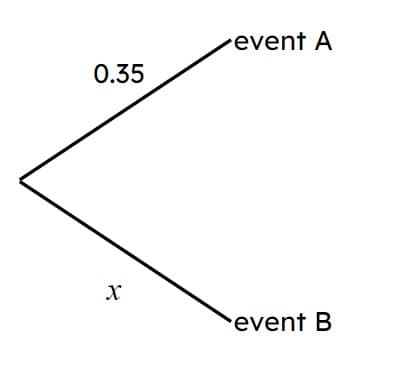
Q4.This probability tree shows the probability of one of two events occurring.
The value of $$x$$ is .
Q5.Lucas and Izzy each play one game of squash that they can either win or lose. P(Lucas wins) = 0.6, P(Izzy wins) = 0.7. Use the probability tree to find the probability that they both lose their game.
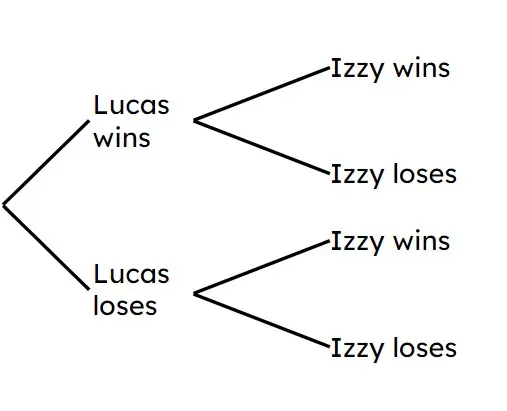
Q6.Lucas and Izzy each play one game of squash that they can either win or lose. P(Lucas wins) = 0.6, P(Izzy wins) = 0.7. The probability that at least one of them loses their match is .


